The annual report becomes interactive!
- Engage the audience
- Innovative report format
- Communicate complex data
«The collaboration with The Visual Agency has enabled us to make our annual report completely digital and accessible to our entire community of 35,000 user companies. The use of data visualization has helped to grow a data culture and performance measurement in the organisation. Not to mention the quality of design and user interface, which have always been very successful and powerful.»
Explore the project
Already in its third year, this project has increased visibility to GS1 Italy's core topics and annual performance. Structured in dedicated chapters, each section gives the reader the opportunity to investigate and learn more about the client’s core KPIs. The background pattern is dynamically generated: each time the site is accessed, the shapes change, creating a unique user experience.
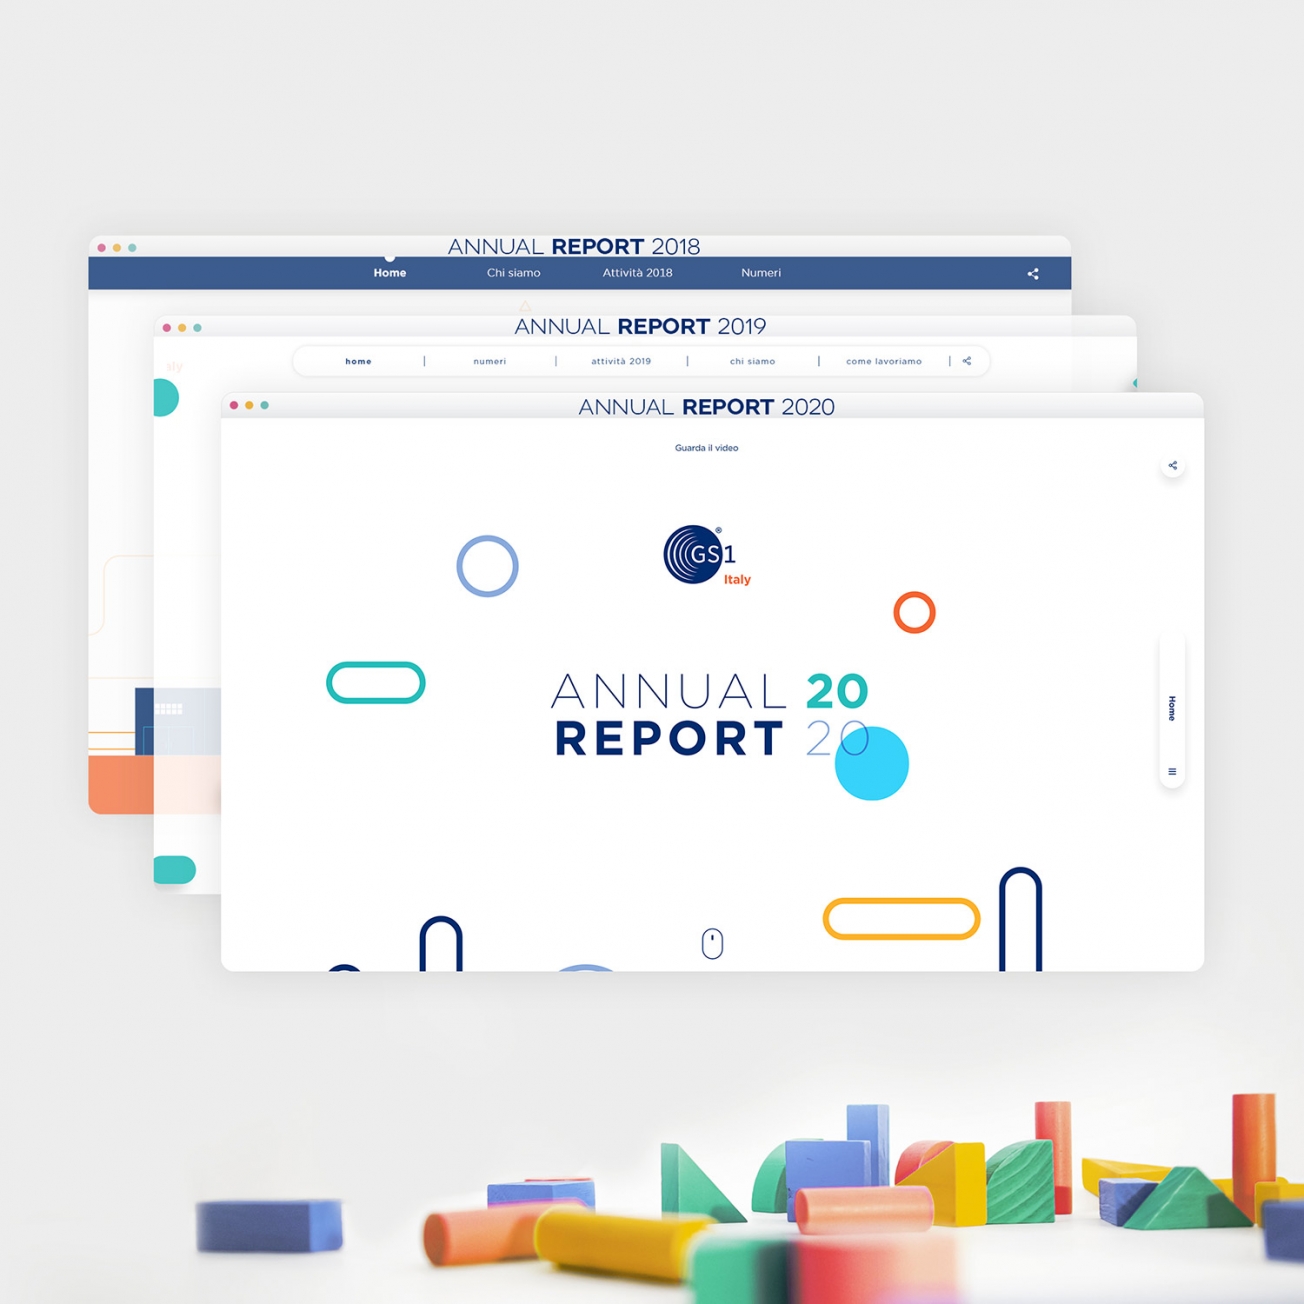
The structure
The microsite is organised in 5 chapters:
- Home
- Numbers
- Activities 2019
- About us
- How we work
An opening video explaining the client’s key activities in 2019 is embedded into the homepage of the microsite.


KPIs and Business Strategy visualized
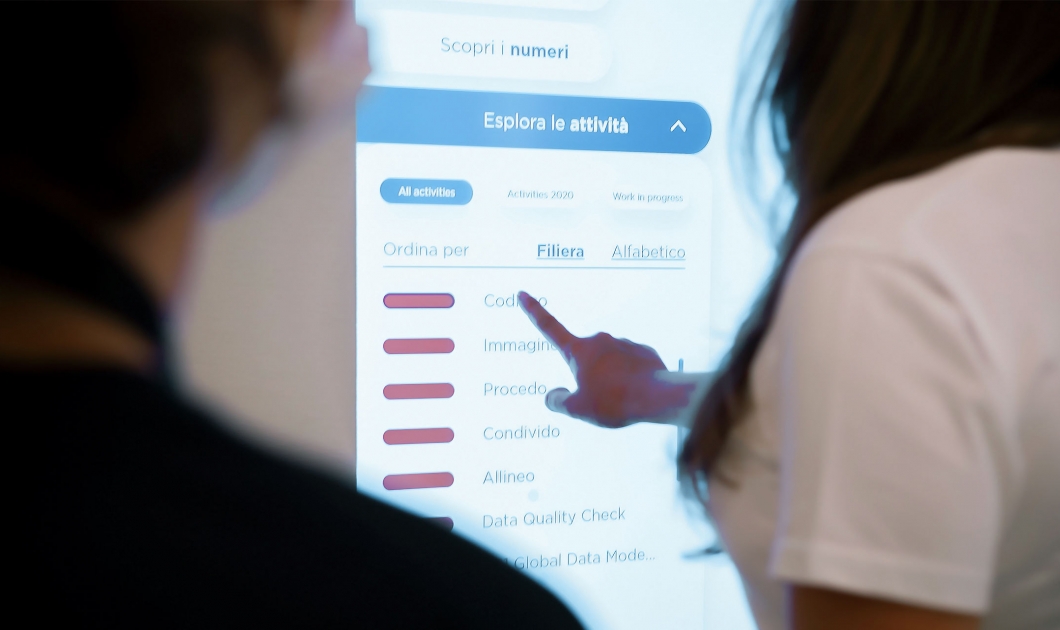
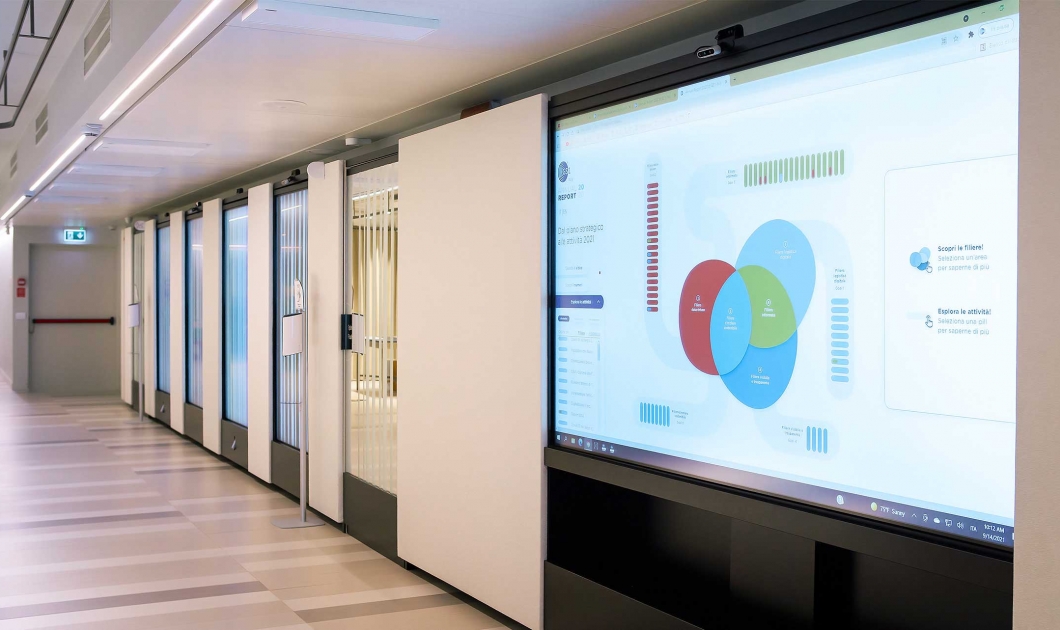
Moving away from a text centric and word heavy approach, the core of the microsite is an interactive visualization of the client’s 2019 core activities and projects. This visualization gives the user the opportunity to gain quick insights based on individual interests. All activities are clickable and can be accessed for further, more detailed information. The user can decide to explore the content following the two different approaches below.
By topic
All projects and activities have been grouped into 6 specific themes that are represented with different geometrical shapes such as circles, triangles and squares. They are positioned on a concentric radar visualization that is split into 6 topical areas. Furthermore, all activities and projects are color coded depending on the strategic goal to which they contribute.
By strategic goal
All projects and activities are sorted in boxes according to the strategic goals they belong to. With a simple mouse over the user can immediately see which and how many activities the client has undertaken and to which strategic goal they belong.
Navigation and multimedia content
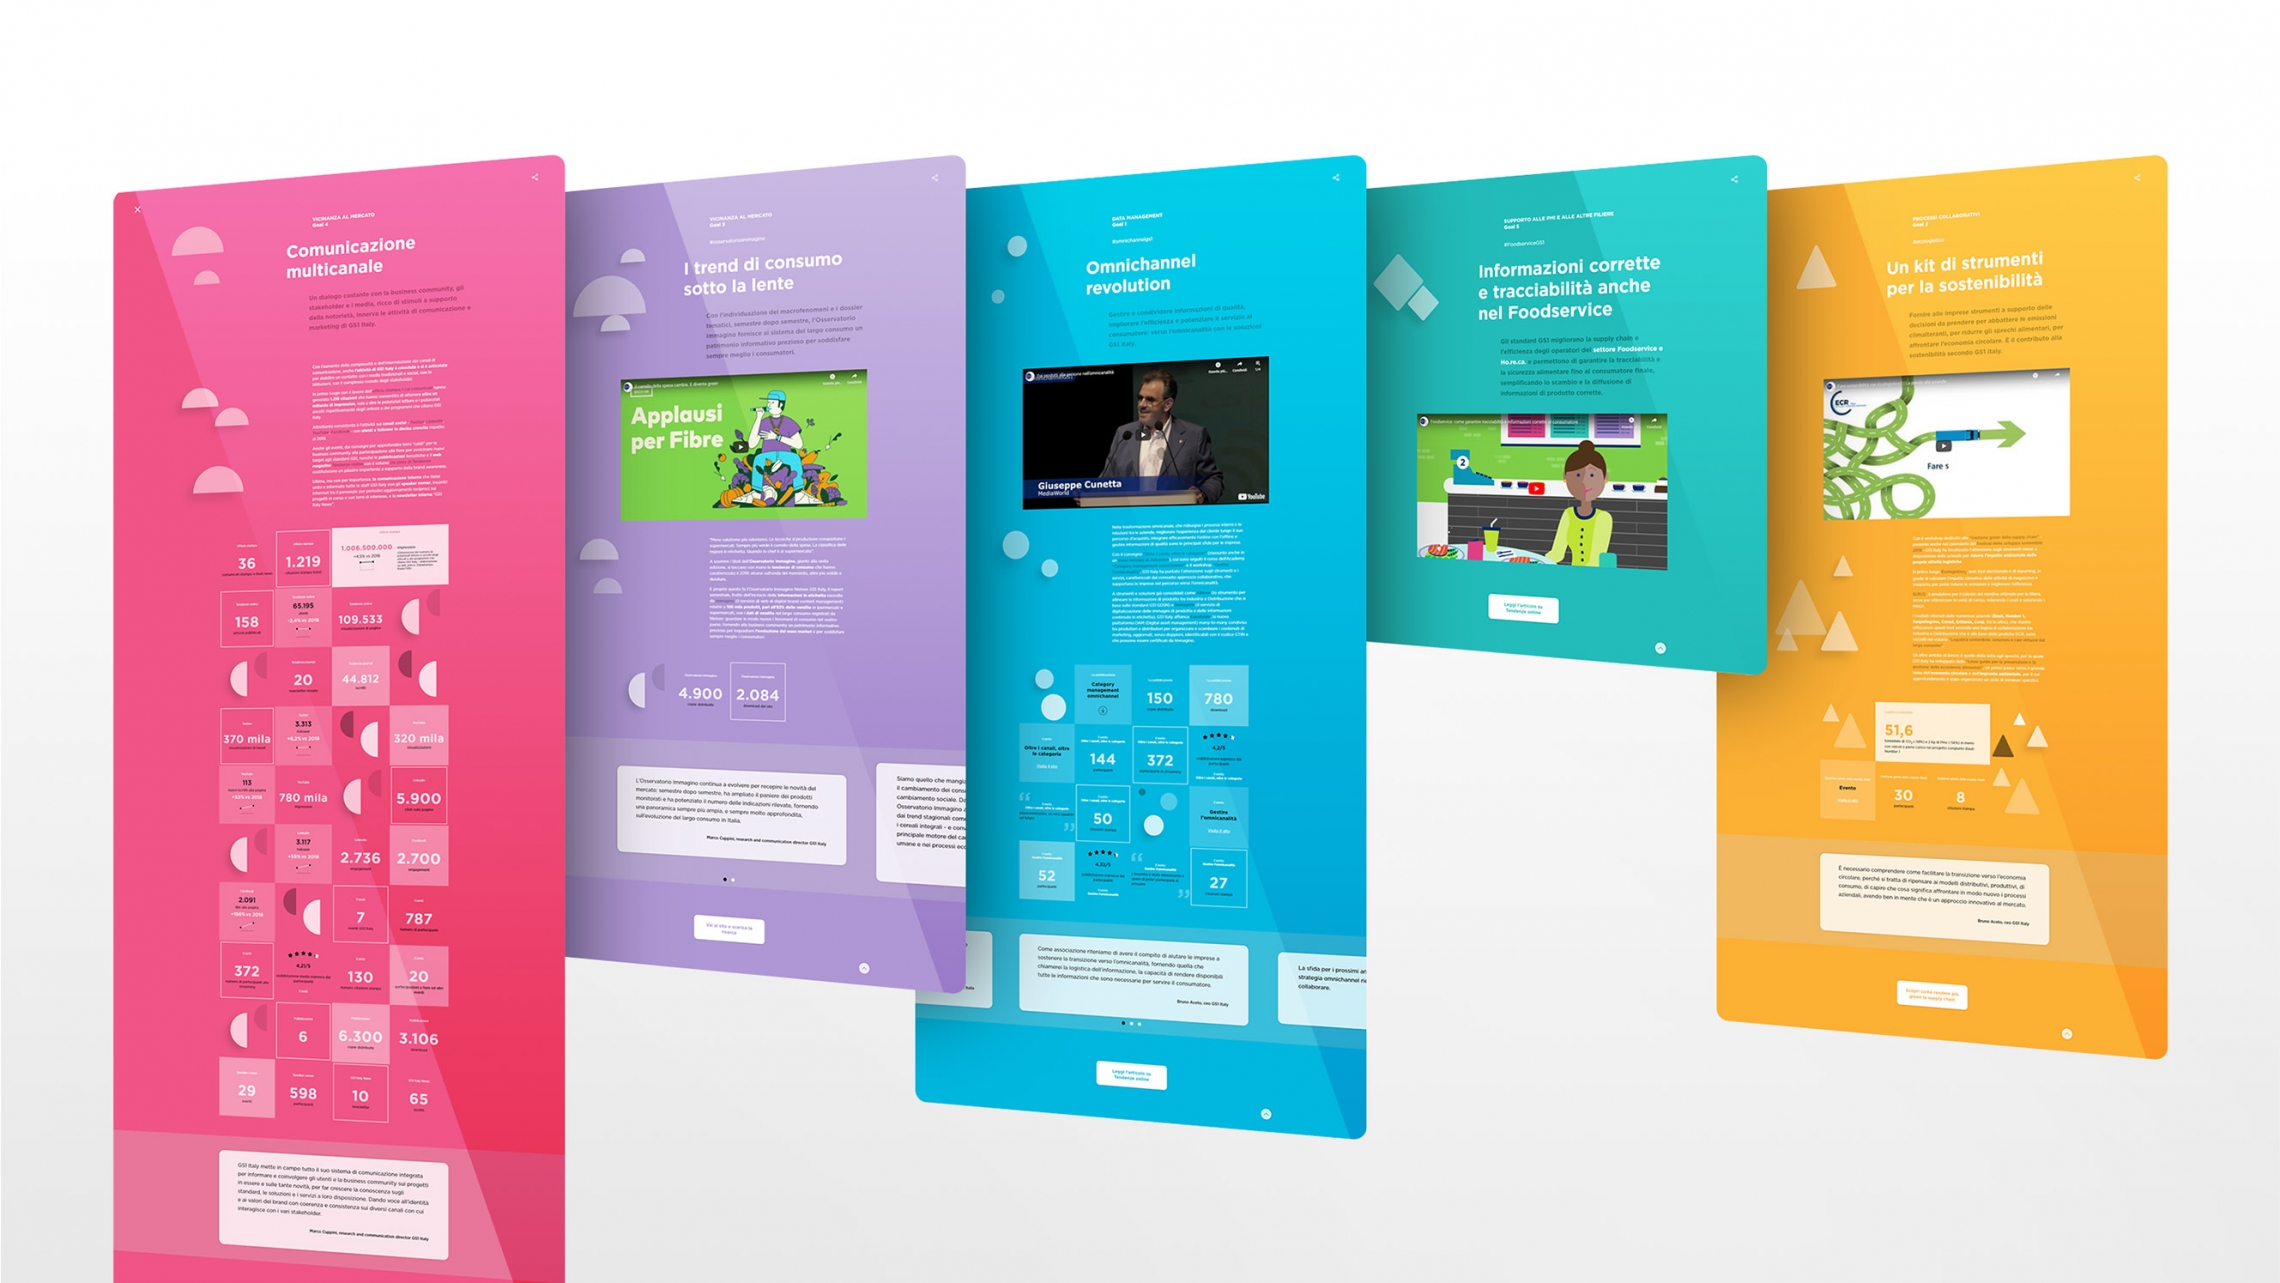
Besides the core visualization, the user can explore each strategic goal and each activity in a separate session. All goals are colour coded and each activity explained in dedicated pages. These pages are supported by interviews, photos and videos to interrupt text heavy pages and make them more engaging to the audience.
The annual report as a vehicle for communication
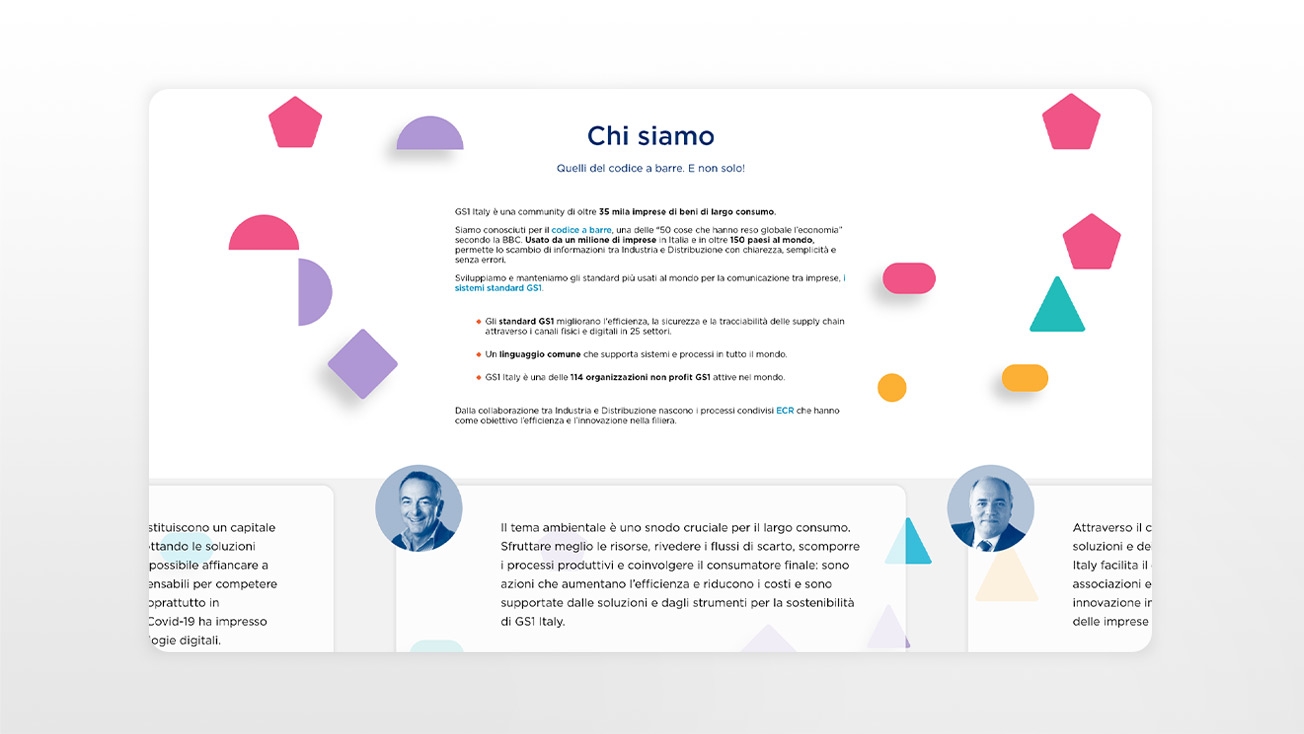
Through the sections “About us” and “How we work” the client had the opportunity to create richer content and to add not only performance-related but also brand-related content. These sections are interlinked with the main GS1 Italy website and are therefore boosting the company’s SEO and online presence.

