To celebrate the Agency's ten years, each week we will publish a new chapter with curiosities, anecdotes, and reflections on the ten years that have just passed and the ten to come.
1. Yesterday, today, tomorrow
November 7th, 2011, 5.51 p.m.
What was just an idea, a dream, an intuition, becomes reality: The Visual Agency s.r.l. is born.
Ten years for a creative agency is not a huge amount: it is a bit more if we think about the fact that, in 2011, there were no agencies specializing in data visualization in Italy.
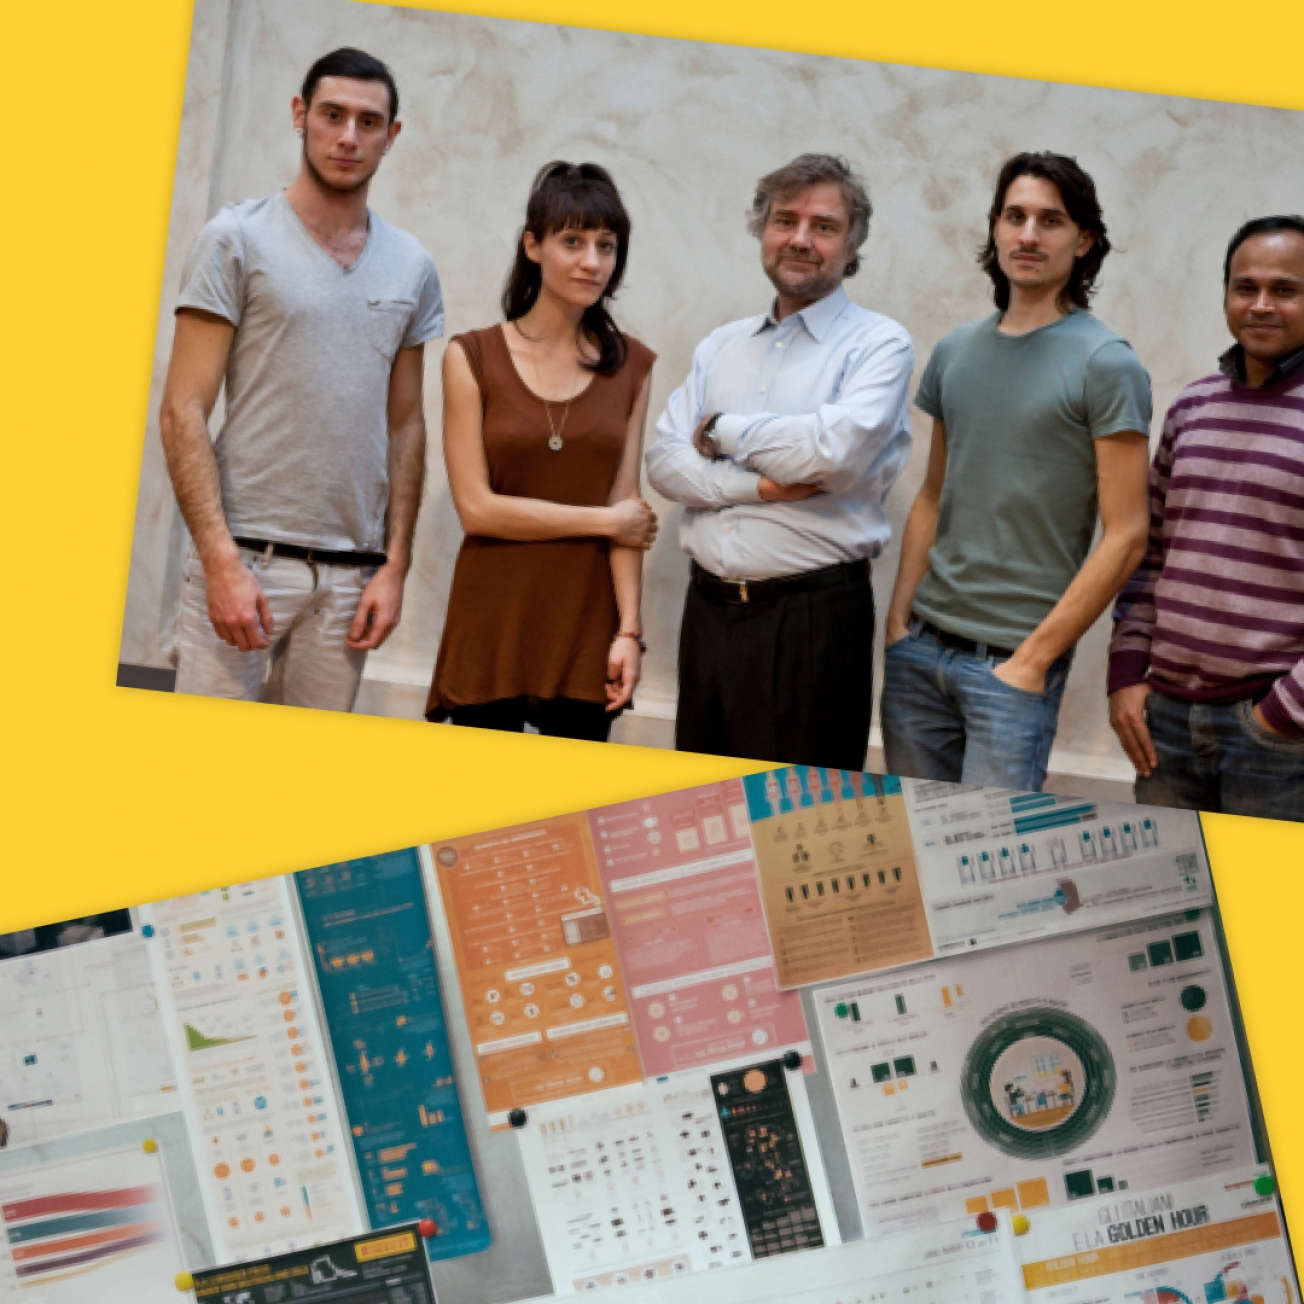
In the 2000s, our CEO Paolo Guadagni was navigating the world of public relations and communication: graduated in physics, emerged as a developer, then moved to marketing, public relations, and finally, data visualization.
Anything but a standard path.
Combine this versatility with a context of innovation and excellence such as the Politecnico di Milano and its Density Design Lab, then led by our mentor Paolo Ciuccarelli, and you have the recipe with which The Visual Agency was designed from the beginning.
We started out as a small studio of four people, mostly focused on the production of infographics and videos. We became a multidisciplinary agency that makes digital its core business.
Even if today we are thirty professionals from the most diverse backgrounds, we’ve never abandoned the mission and the values that, since the beginning, are the basis of our daily work
What awaits us in the next ten years is not known: what we are rather certain of is that The Visual Agency will face them with the same vision and initiative that has characterized us in the ten years just passed.
2. The three main ingredients of success:
People
People
People
Plus a fourth: people.
Yes, in a world that relentlessly winks at process automation, people still remain the cornerstones of success.
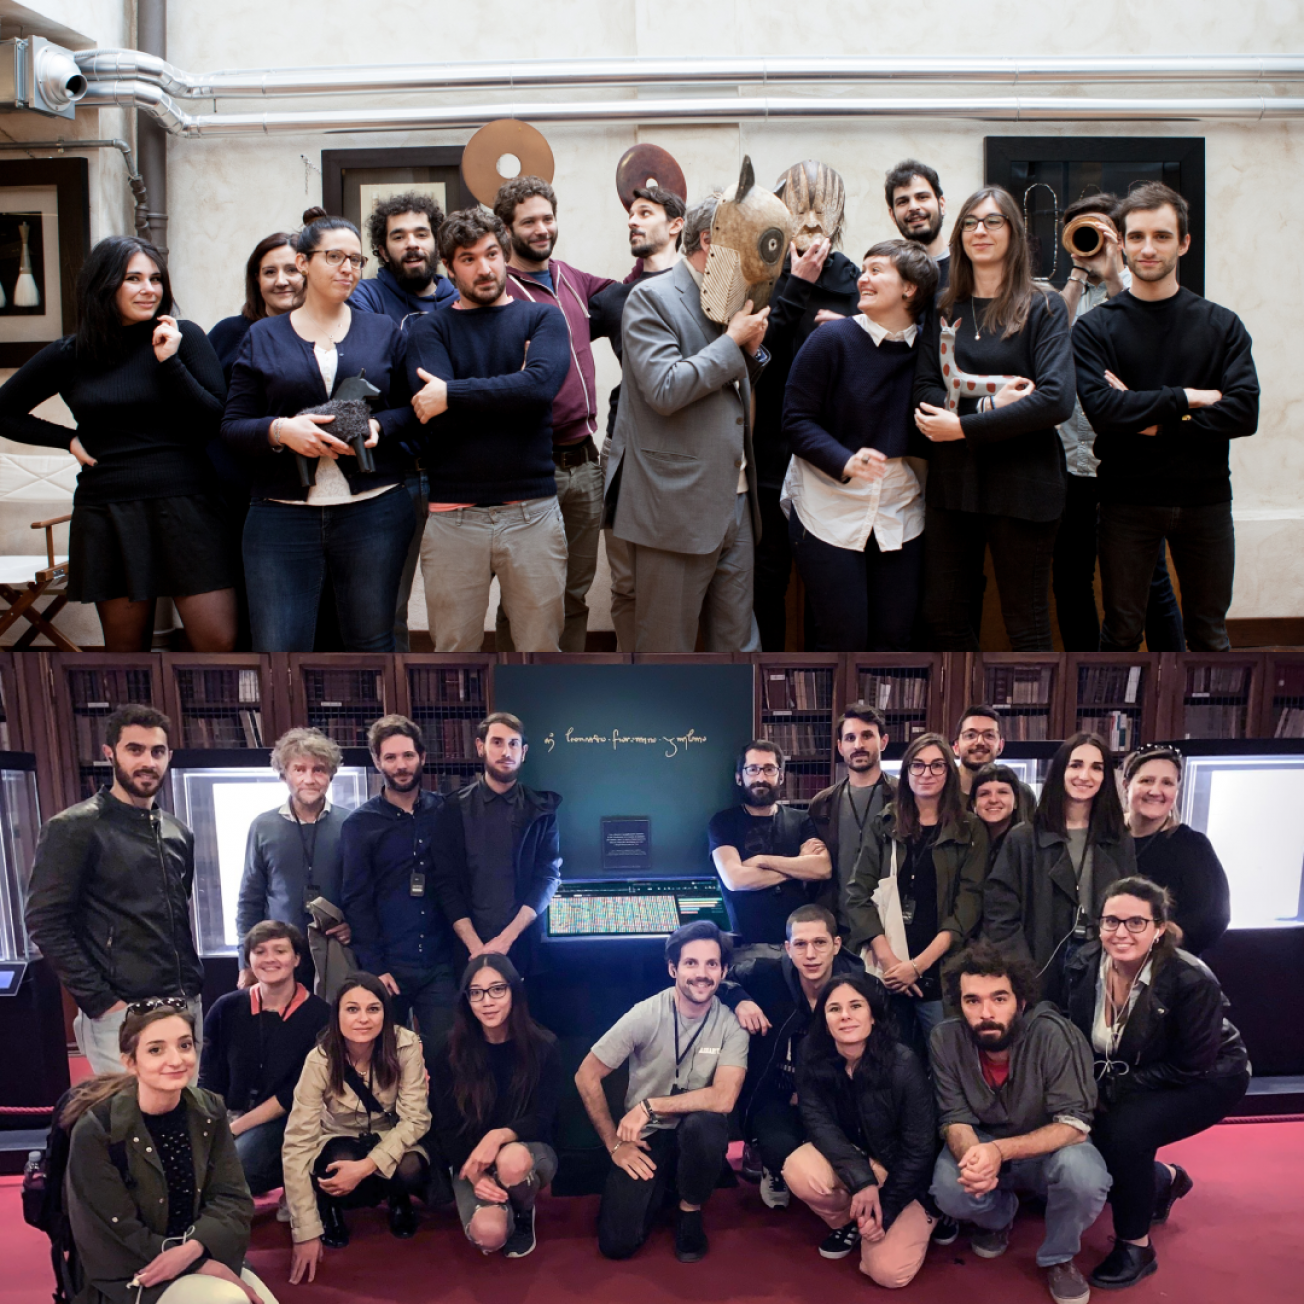
First of all, thank you.
We say thank you to all those who have made and are making this journey possible: colleagues, collaborators, partners, stakeholders, associates, customers, supporters, friends. Thank you!
Without you, we wouldn't be here today.
A lot has changed in these ten years.
In the early days infographics, tableaux de bord and posters represented the agency's main business and more than half of the agency's annual turnover.
Today, that's no longer the case: the share reserved for digital projects has grown steadily and interactivity has taken center stage.
However, the increasing digitization of our professional and daily lives also highlights the importance of human value in any kind of organization.
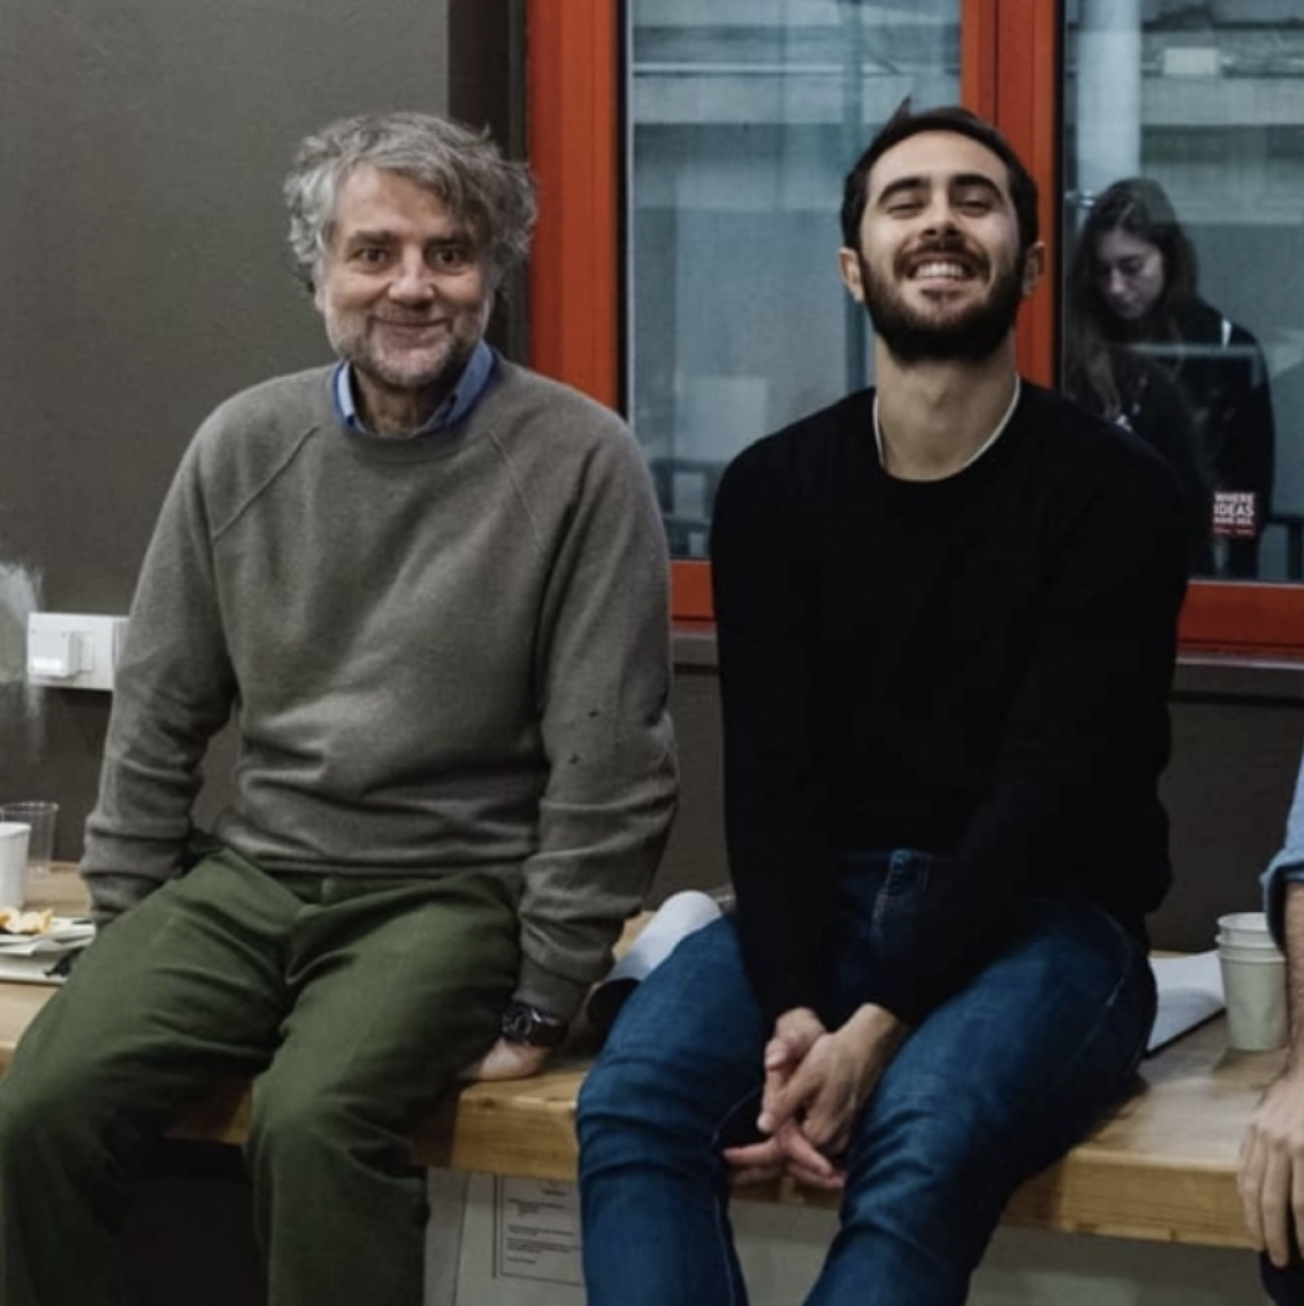
No, Artificial Intelligence will not steal our jobs.
While it is true on the one hand that many areas are automating and some production processes are increasingly being delegated to artificial intelligence, the human touch is just as crucial.
First of all, from a technical point of view: as tools increase, so does their complexity and, consequently, the level of expertise required to use them.
In addition to being increasingly complex, digital tools offer endless possibilities: identifying the potential and implementing it is the responsibility of the human brain, certainly not AI.
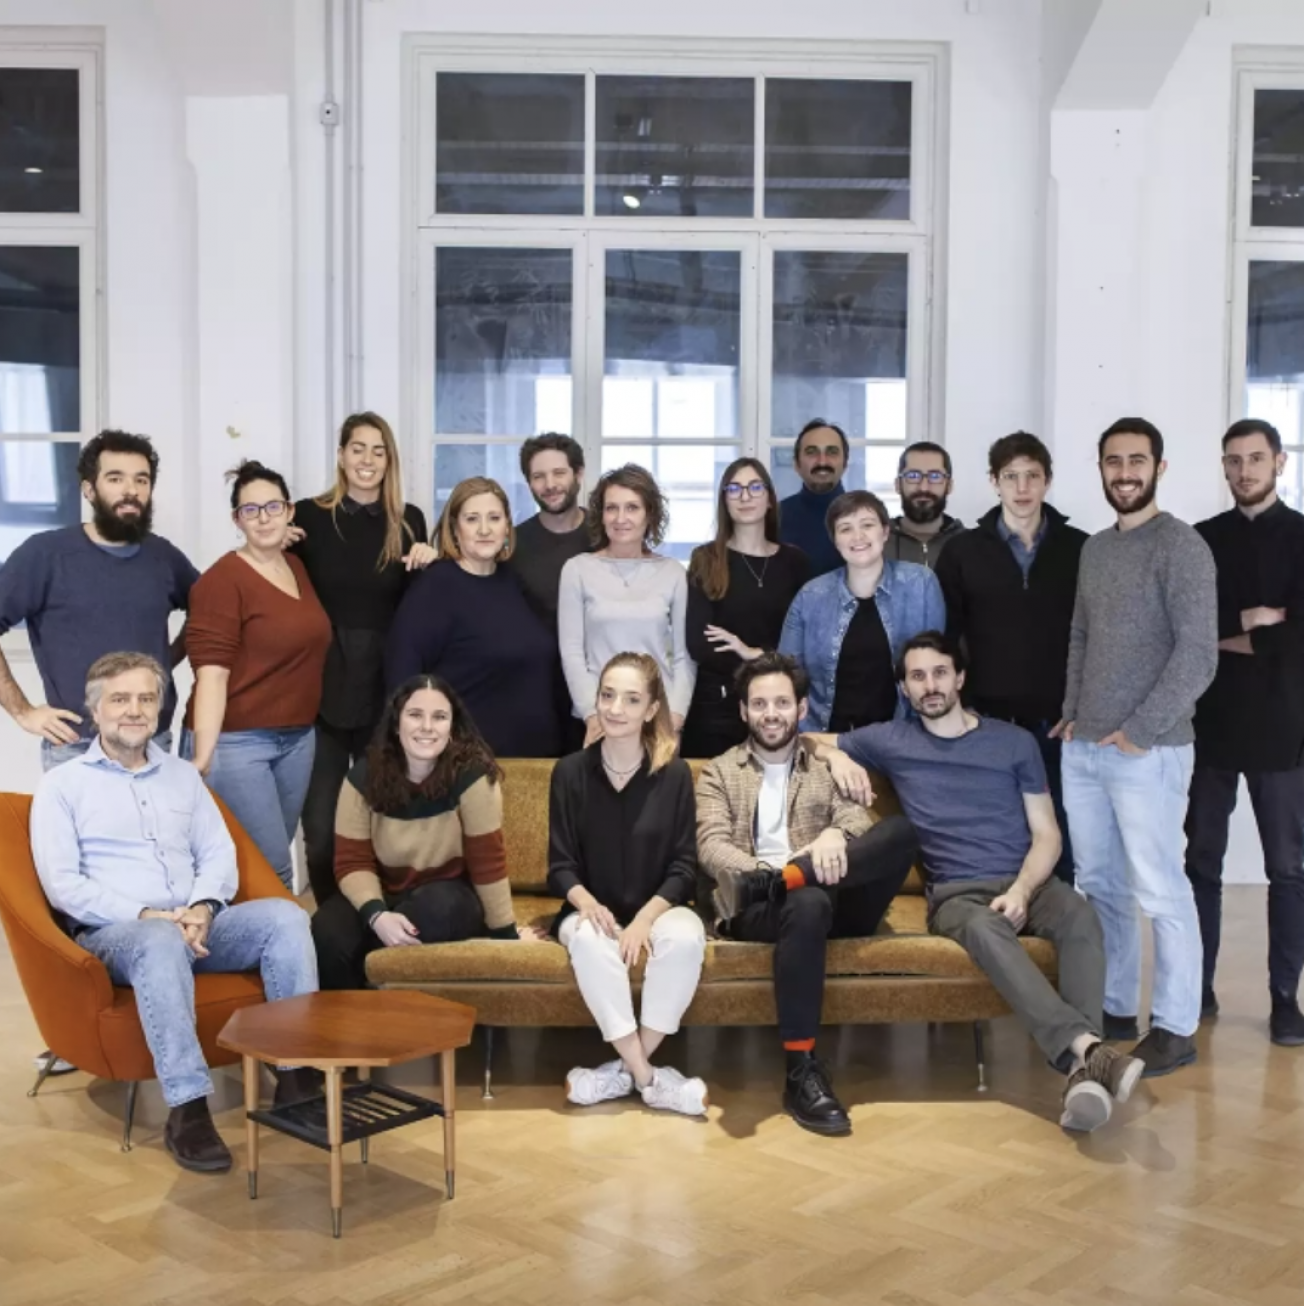
Yes, diversity makes the difference.
We believe it's critical for any company to pursue diversity in their teams. And in our small way, these ten years have proven it.
Each individual is unique and brings their own added value: the more heterogeneous a team is, the more it will be able to realize disruptive and innovative projects.
The professional and educational background, cultural background, and our different origins determine our identity as a single entity.
3. Design synonym for experiment
Looking ahead, always.
Designing, experimenting, developing, testing on repeat, 10 years ago like today.
We have always put great effort into the ideation of new concepts, formats, and communicative languages: what better guinea pig than the agency itself?
Like any other respectable agency, we put a lot of care and attention in the presentation of the projects we create together with our clients.
Today, though, we want to tell you about a series of projects that are just as important but that do not always receive the attention they deserve.
Unleashing creativity
To allow our designers to experiment with new approaches without boundaries, we allocate a lot of resources for the realization of internal projects that have no commercial purpose: the so-called side projects.
Annual report, what a bore.
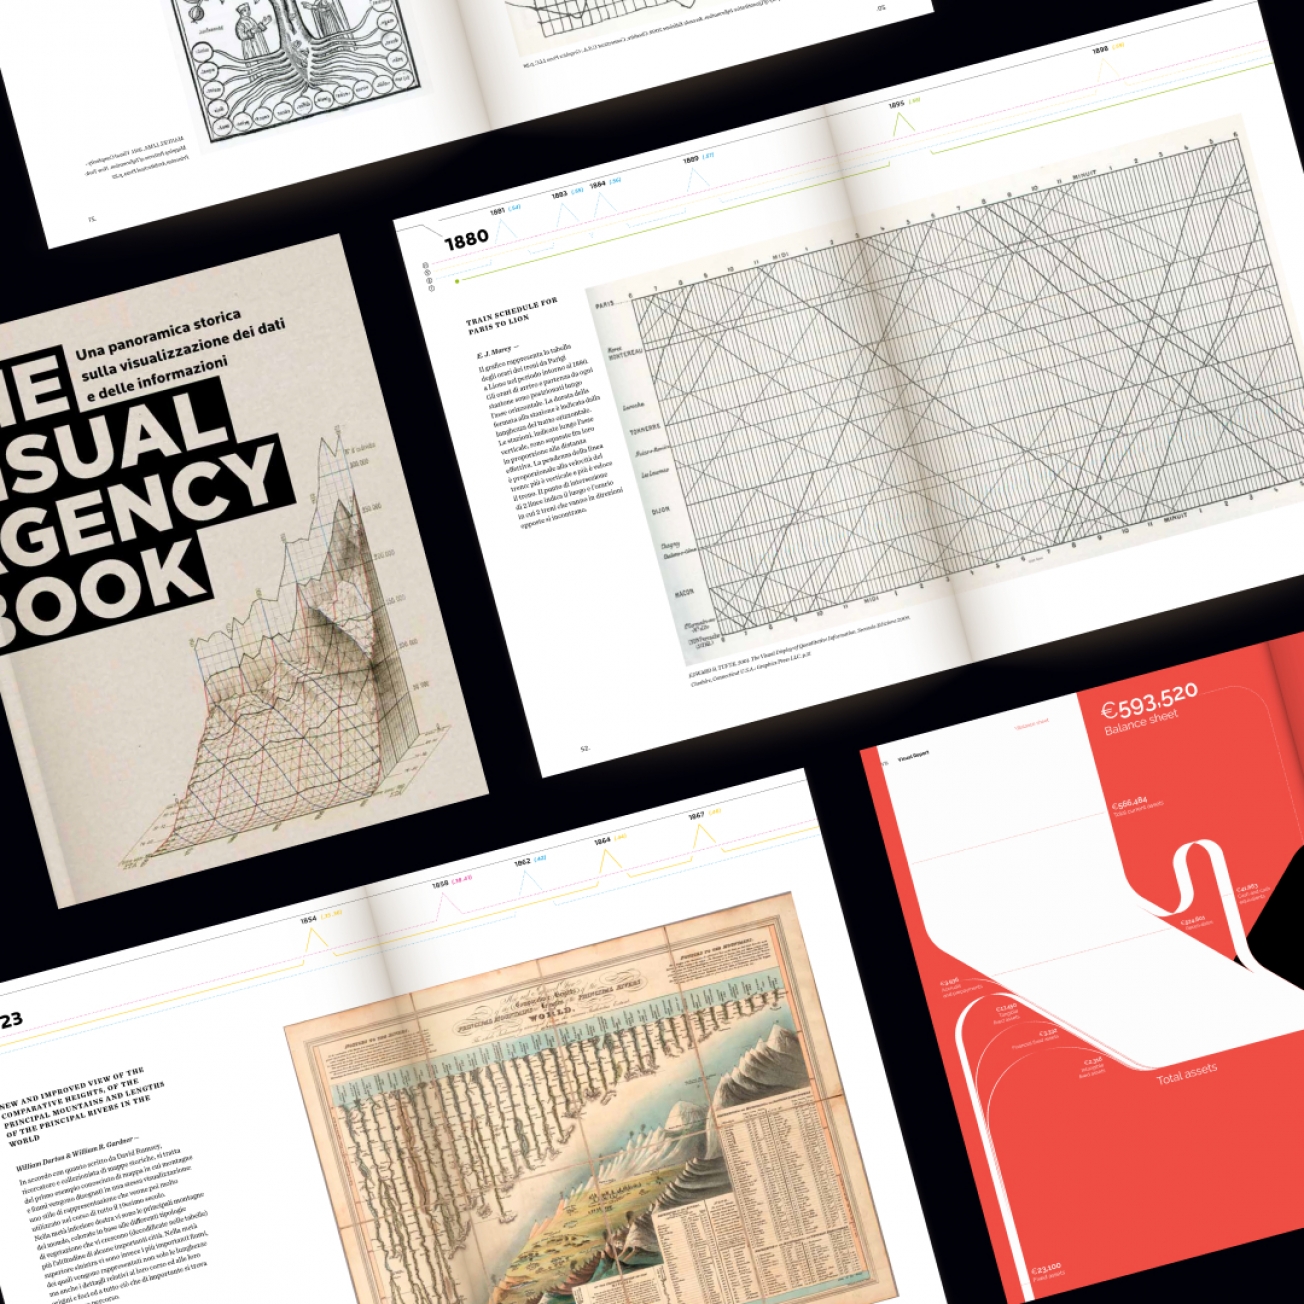
One of the projects we have worked on the most over the years is undoubtedly our annual report. Mandatory by law, not particularly stimulating in its typical static format, we’ve innovated its content presenting it in new and pioneering ways since 2014.
We started with a video, later on we broadened our horizons with an interactive format, eventually exploring the depths of data physicalization and sonification.
Experiential marketing
We take any chance to experiment.
Even when it comes to communication and/or marketing content (and as you may well know, we do create a lot of that at The Visual Agency).
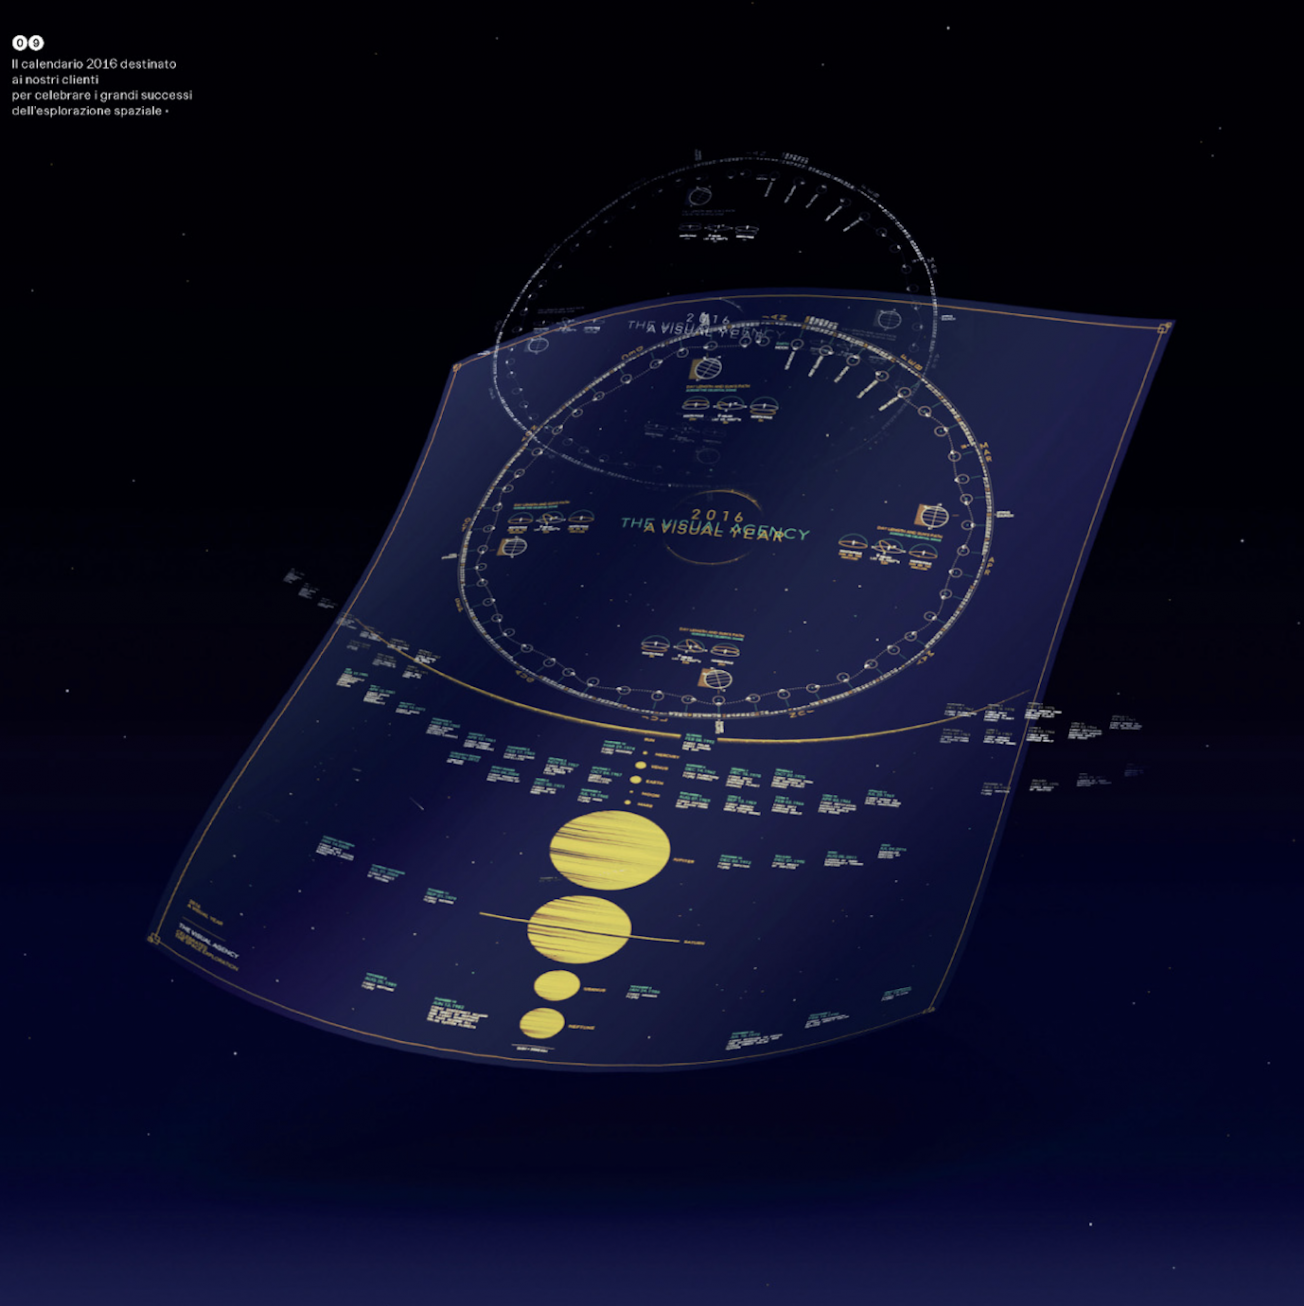
In this case, it's our calendars which we send as posters to a selection of customers every year.
Each calendar explores a new way of visually representing the year and has a specific theme: in 2014 it was festivities around the world, in 2015 Milan’s Expo, in 2016 the Space et cetera.
Do you know what is our first side project?
Download it here for free (ITA only)!
4. How much data in this Sunday insert
And it will never be enough!
LaLettura, the cultural insert of Il Corriere della Sera, has recently turned 10 years old – just like our agency.
Two stories intertwined: La Lettura and The Visual Agency, data design, and high-quality information.
"Visual Data is one of the key innovations that characterize the editorial offerings of laLettura: the Taj Mahal of graphic representation."
Ferruccio De Bortoli - Former Editor-in-Chief, Corriere Della Sera.
Information Design to the nth degree
The aim of Information design is to present information as clearly, effectively, and faithfully as possible.
Hence, it’s only natural that it reaches its highest form when it meets with the major Italian newspaper: Corriere della Sera.
A place for experimentation. For all.
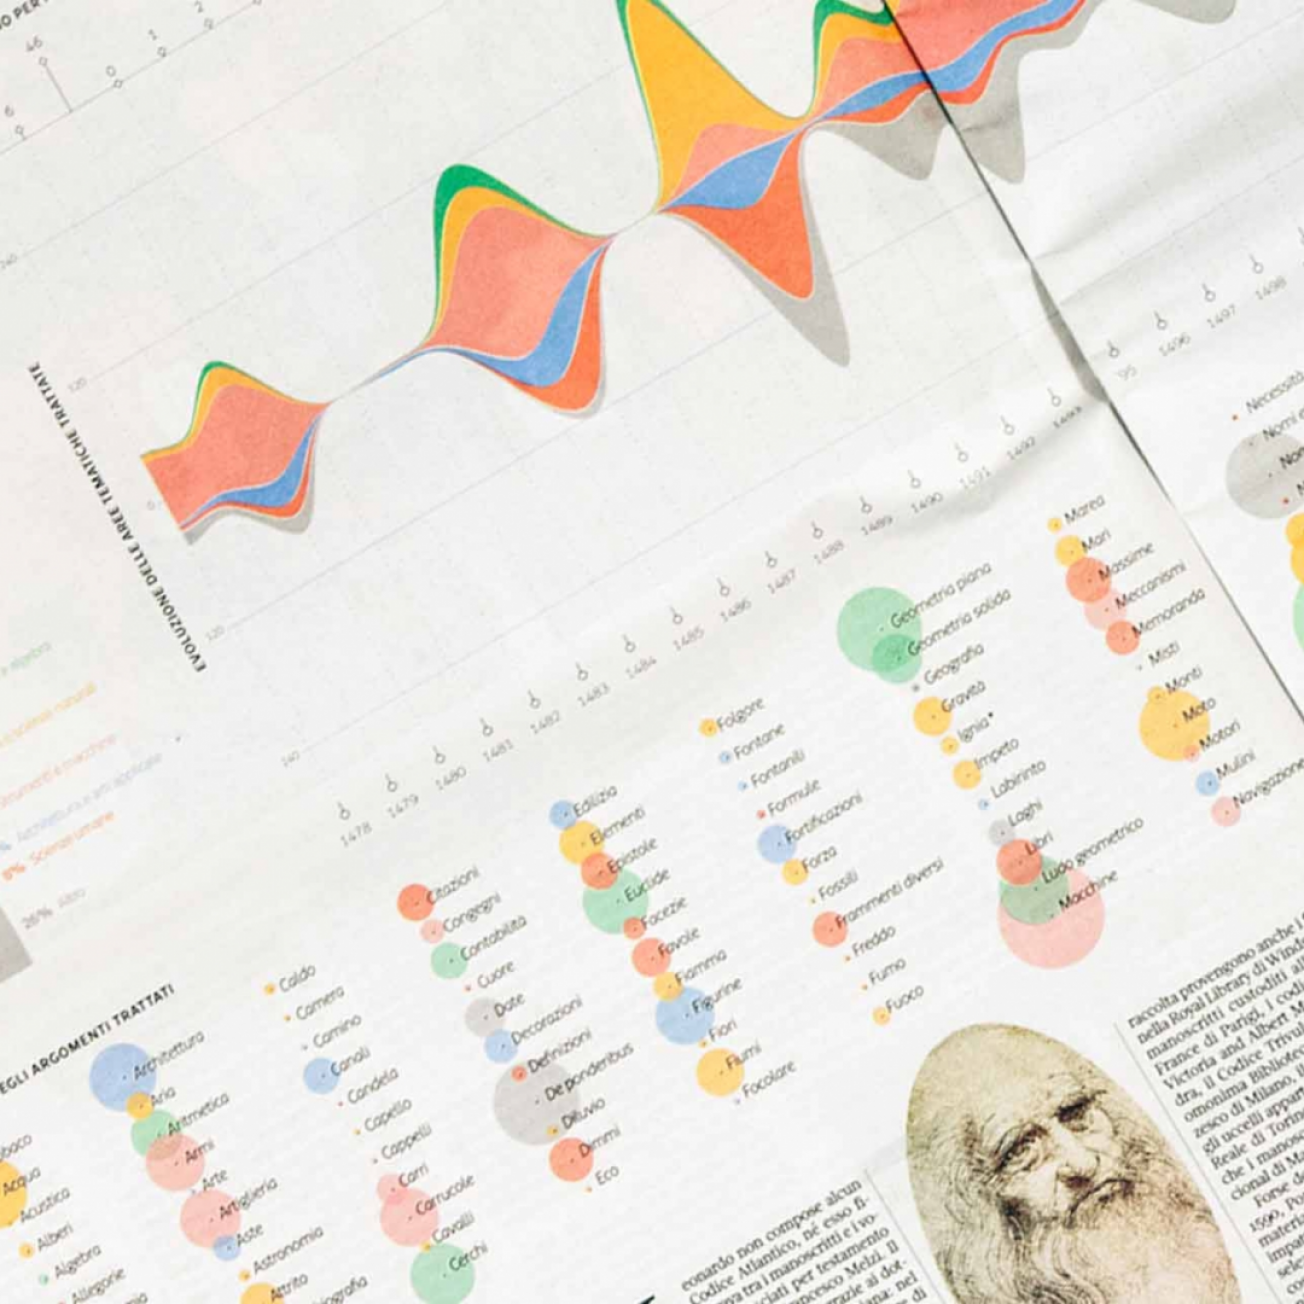
Coming out every Sunday, the Visual Data section is a place for true experimentation.
From the very first 27-centimeters square to today’s double page, designers have the opportunity to work in a “safe place”, combining aesthetics with readability.
At the same time, the publisher can go deeper into topics and stories through innovative formats for a quality audience.

10 years together!
We have collaborated with the cultural insert of the Corriere della Sera from the early days.
From 2011 till today, more than ten visualizations tell about the most diverse range of topics: from Linate airport routes to ice cream consumption, from the lives of the Saints to real estate market trends.
5. If digital humanities and design meet
The future of knowledge is in good hands.
Exploiting cutting-edge data visualization techniques to breathe new life into artistic, cultural and humanistic heritage: a powerful combination that has now become a mantra of The Visual Agency.
Those who know us know this story.
It all began somewhat unconsciously.
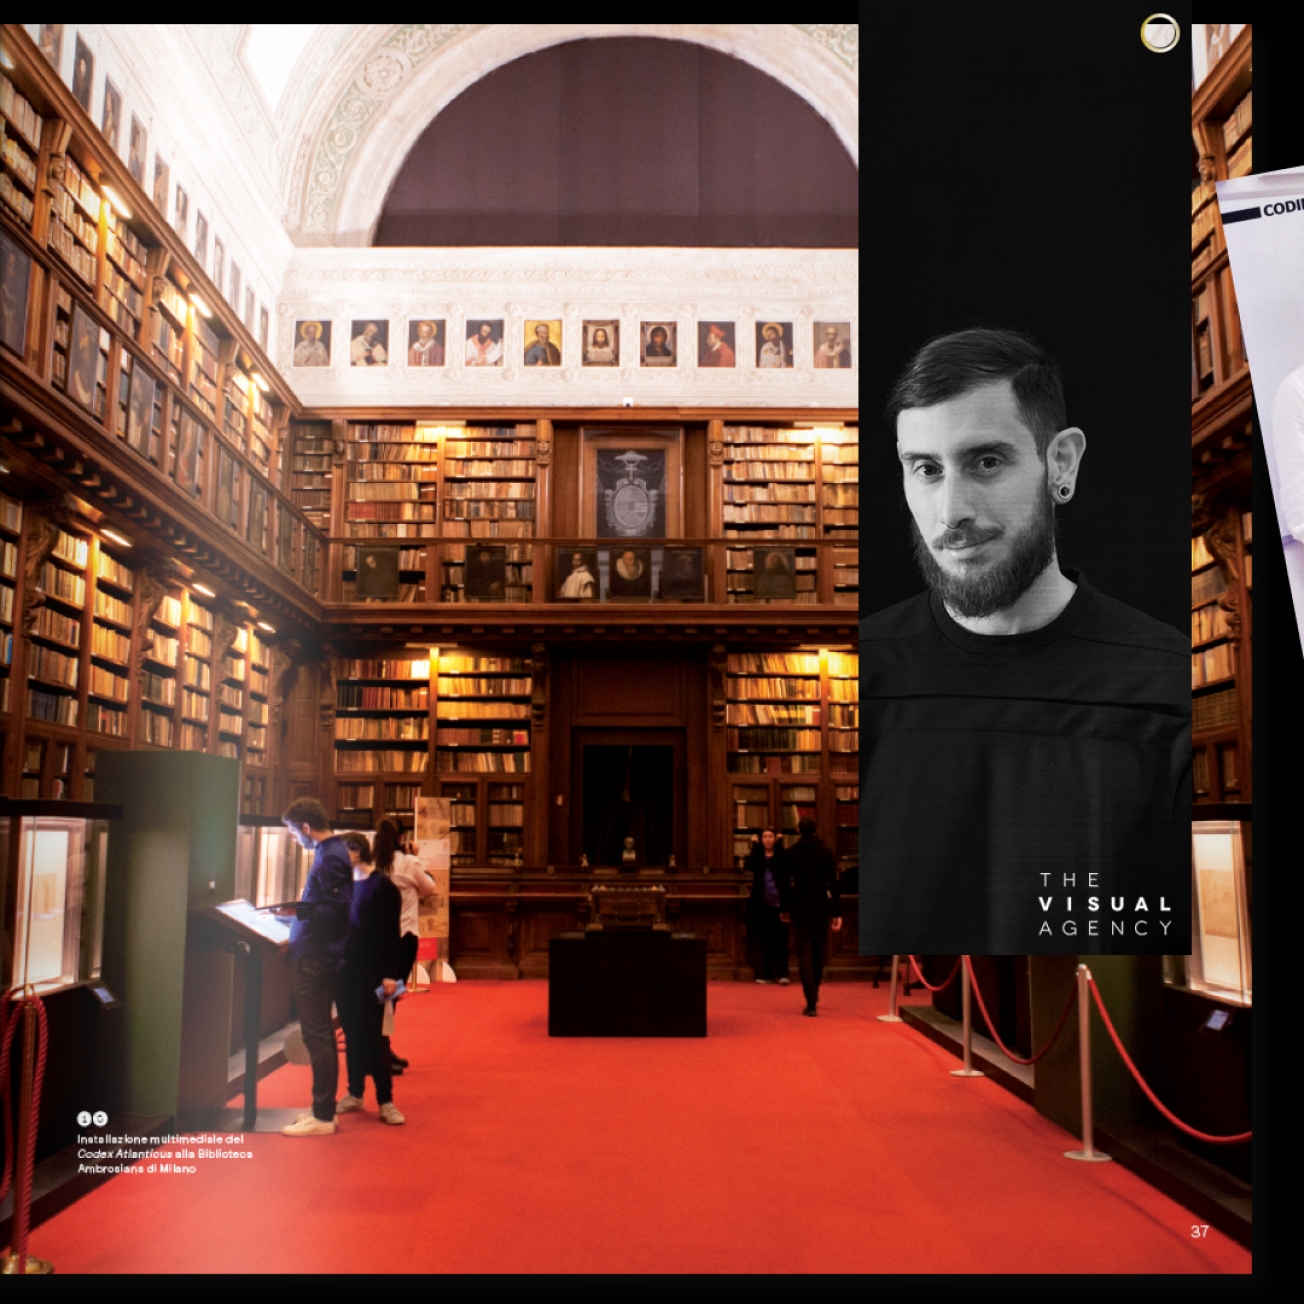
For centuries, the Pinacoteca Ambrosiana in Milan has kept Leonardo's Codex Atlanticus, his largest collection of writings and drawings.
Being able to exhibit only a few sheets at a time due to their fragility, the immense work has never been fully accessible either to the public or to academics and researchers.
Exploring a possible solution with the Doctors of the Biblioteca, we opted for a free interactive website that collects, catalogs and makes navigable the 1119 pages of the Codex: a valuable tool for enthusiasts and scholars alike.
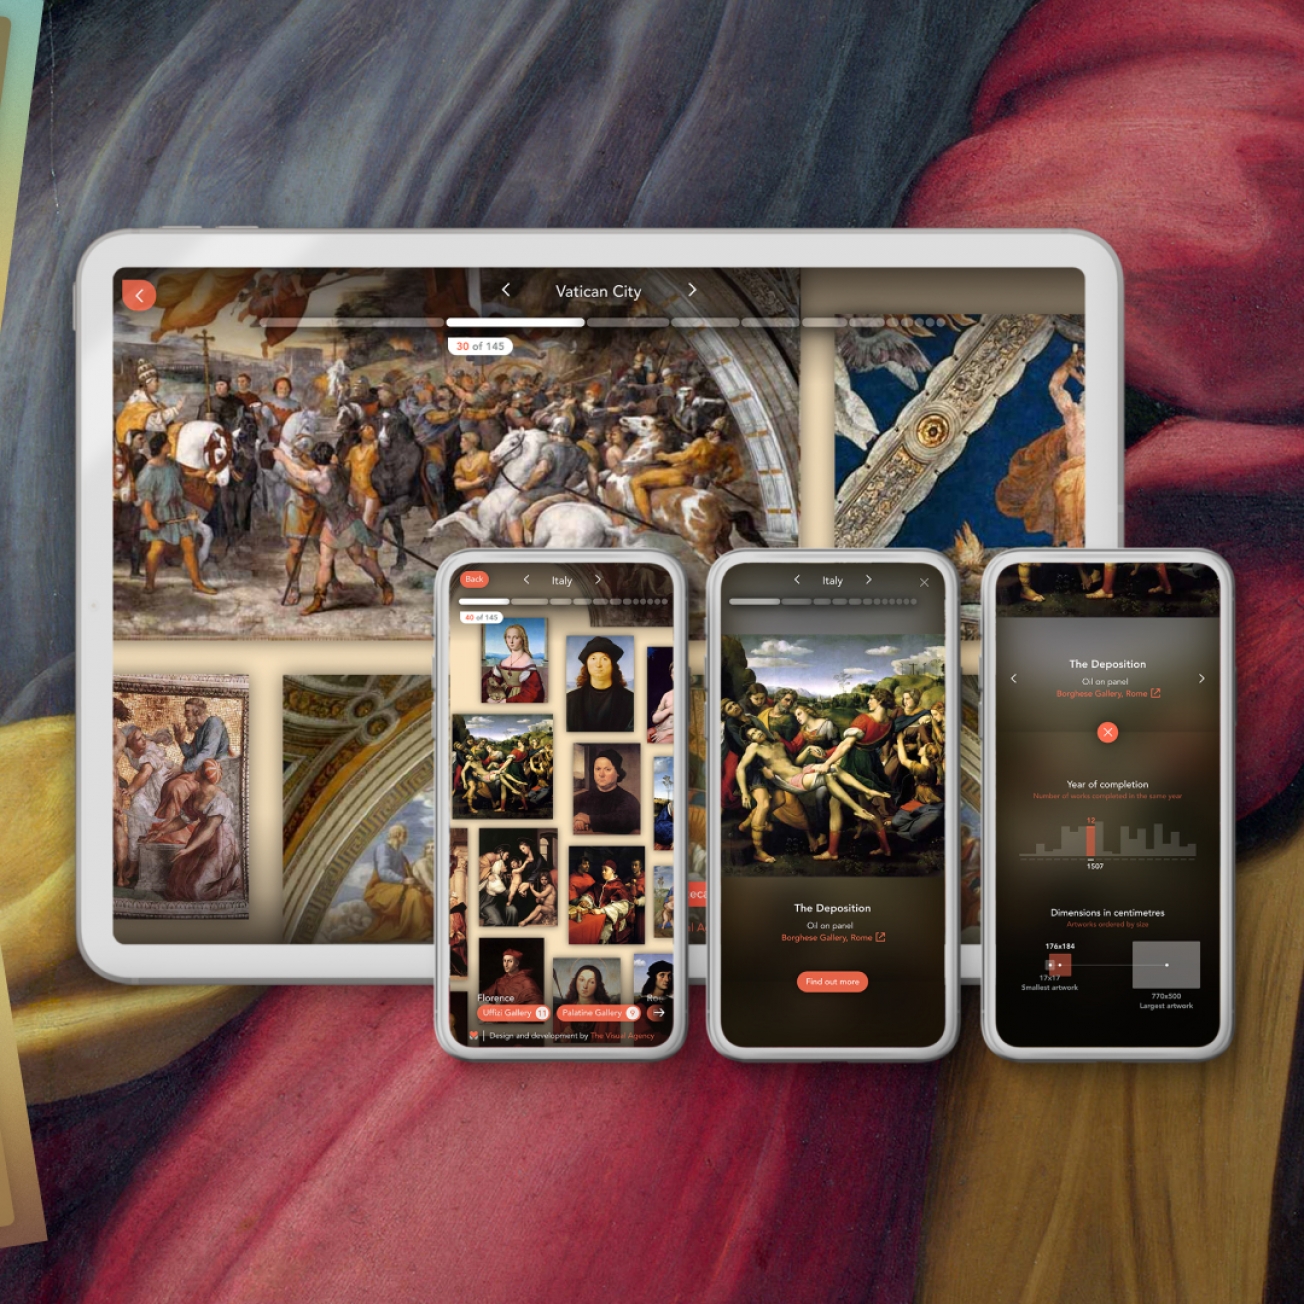
Information design in the service of humanity
Our first digital humanities project was an almost unexpected success: twelve international awards, dozens and dozens of press releases, more than three hundred thousand visits to the website.
So we decided to focus our R&D activities on the field of digital humanities: an opportunity to experiment with new design techniques for us, a service of democratizing the cultural heritage for the public.
From a Code to a Comedy
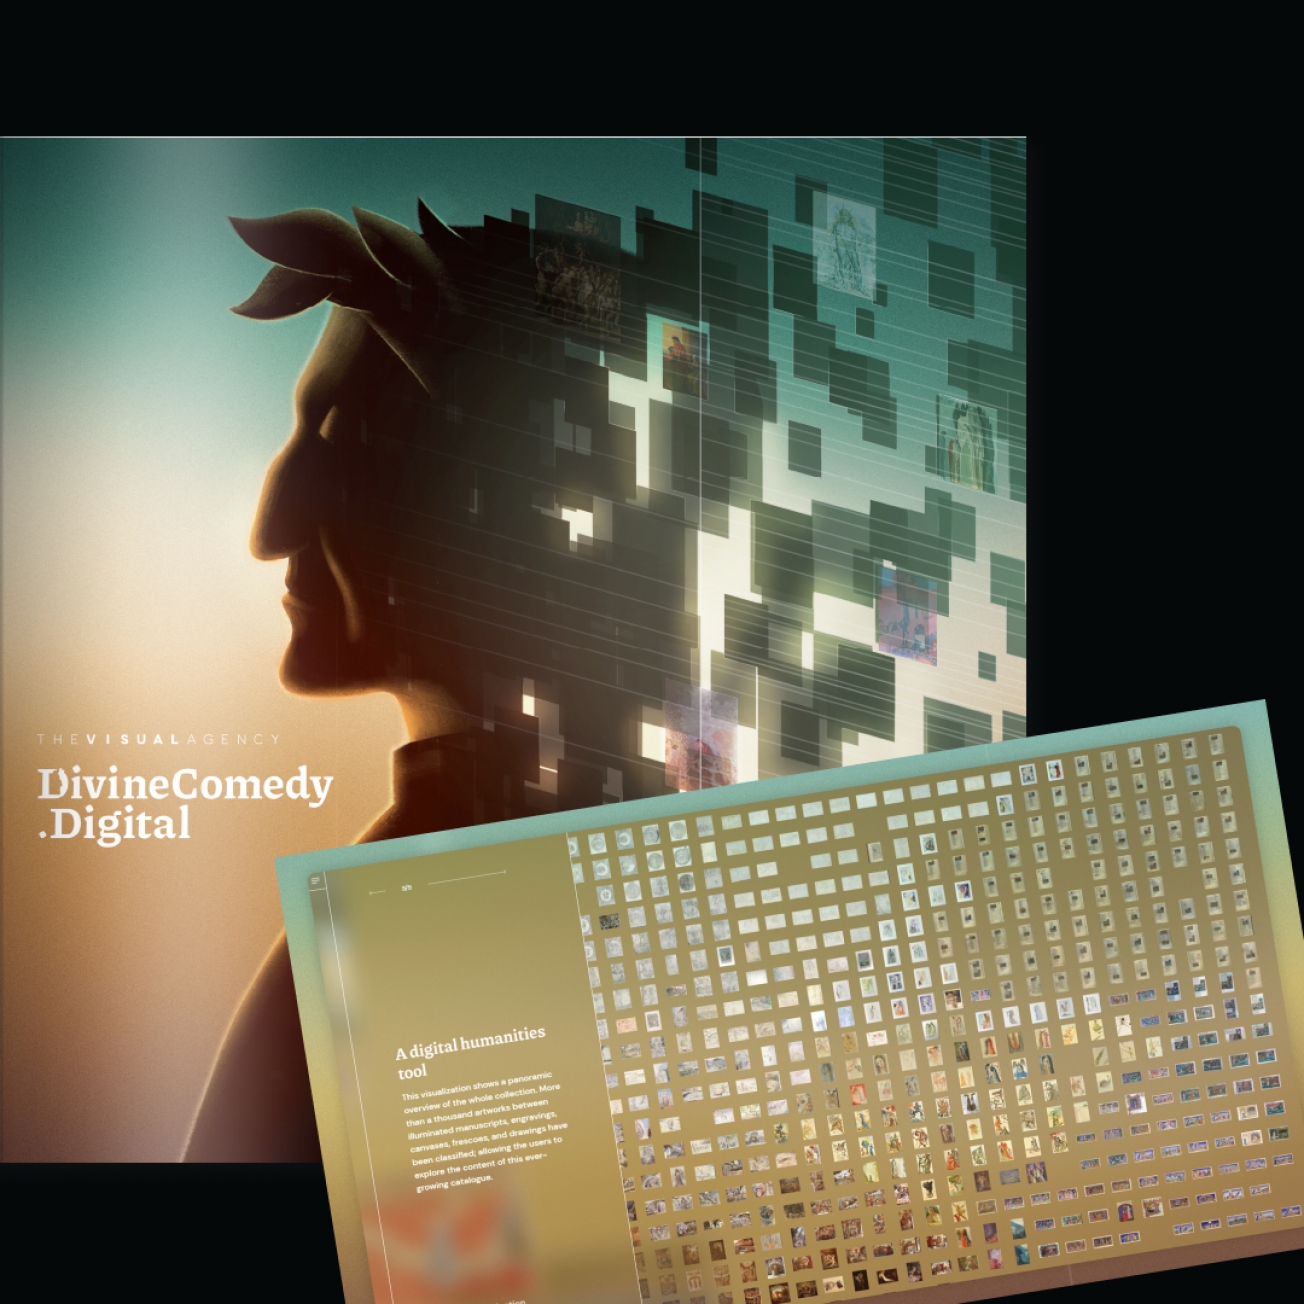
The agency's second major effort was created to celebrate the 700th anniversary of the death of one of the greatest poets of all time: Dante Alighieri.
If the project shares the objective of allowing a complete analysis of the work with codex-atlanticus.it, at the same time it has an even greater ambition: to collect seven centuries of figurative imagery inspired by the Divine Comedy in a single platform, thanks to which it is possible to enjoy the work by listening to the text and viewing the paintings.
6. Thank you for saying «yes, let's do it»
A yes that is all but a given.
"I first met The Visual Agency in 2012. It was a small studio of 4-5 people talking about visual content, an absolutely innovative format for those years. Since then we have faced many changes in the digital communication of Eni, but during these 10 years The Visual Agency has always been by our side."
Roberto Ferrari, Head of Digital Communication Experience & Strategy - ENI.
Many thanks to all professionals who believed in The Visual Agency from day one.
A special thank you goes to those who chose to begin a collaborative journey made of discussions, proposals and ideas.
10 years of agency, almost 200 clients. Of these, some have been with us for more than half a decade.
More than clients, we like to call them partners. More than suppliers, we like to call ourselves collaborators.
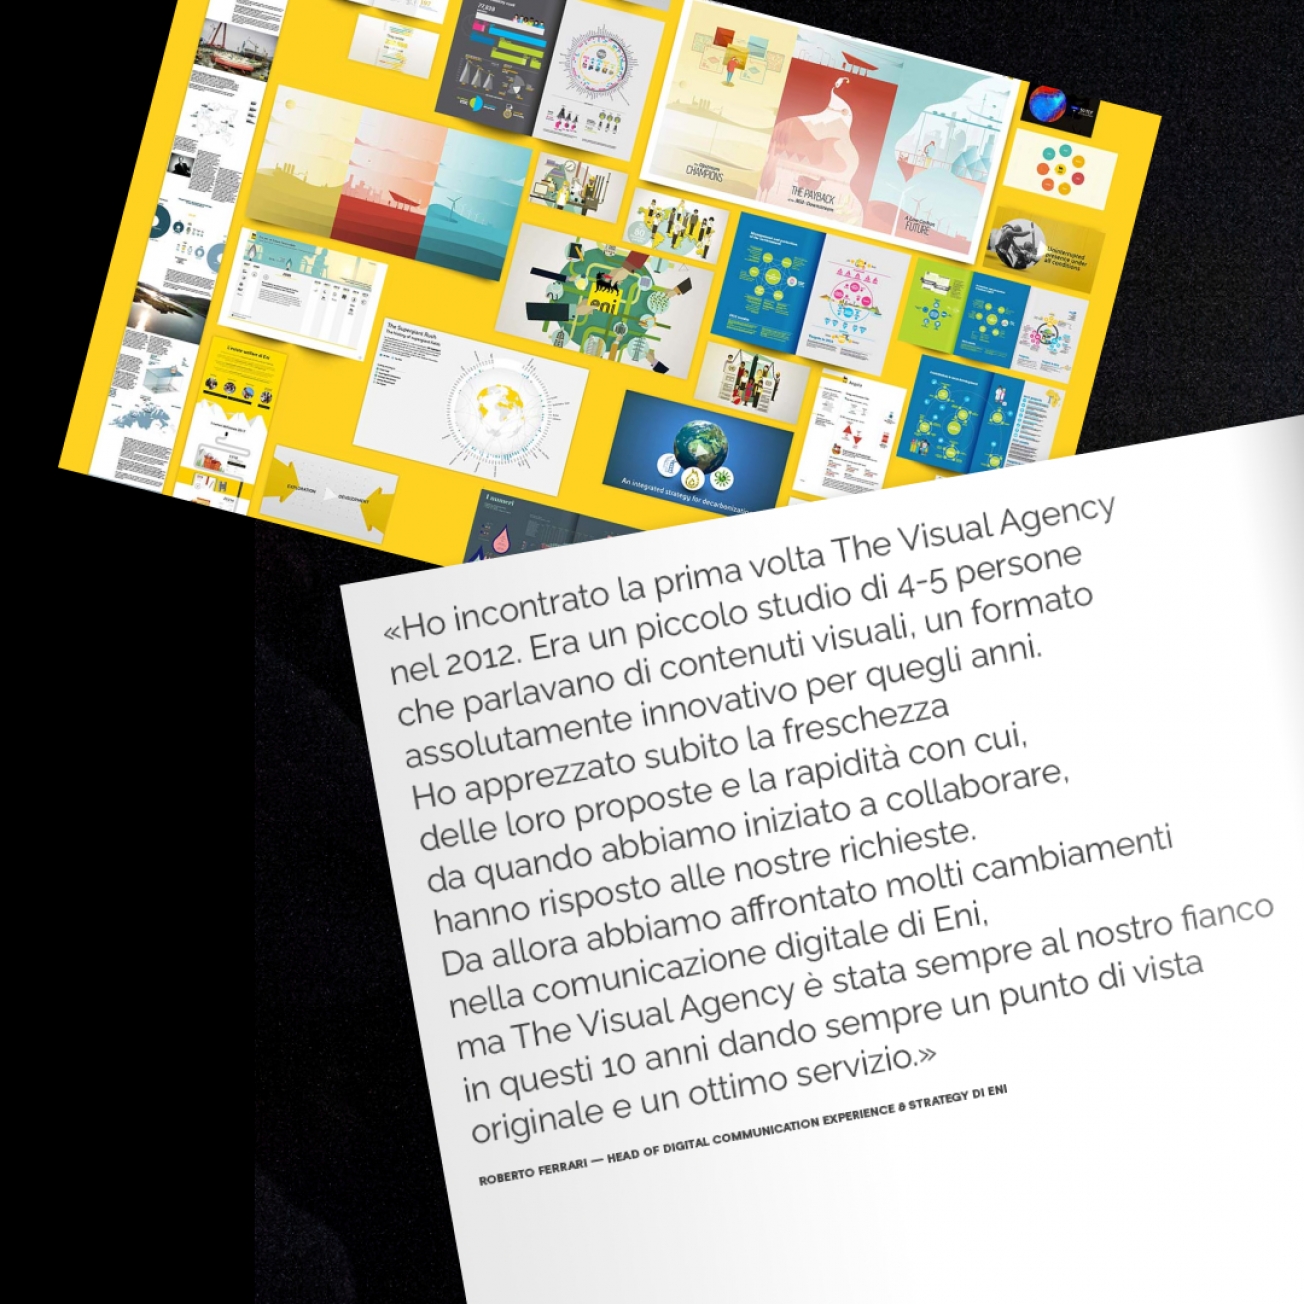
A common growth.
We are a highly specialized agency that as such, has served all, or nearly all, sectors.
Each time we start a collaboration with a new client, we learn something new. At the same time, the client learns something from us.
Whether it is digitizing an annual report or structuring a data design system from A to Z, the goal is always to transfer the know-how and knowledge: to convert certain data or information into business assets and educate and have a more conscious take on data.
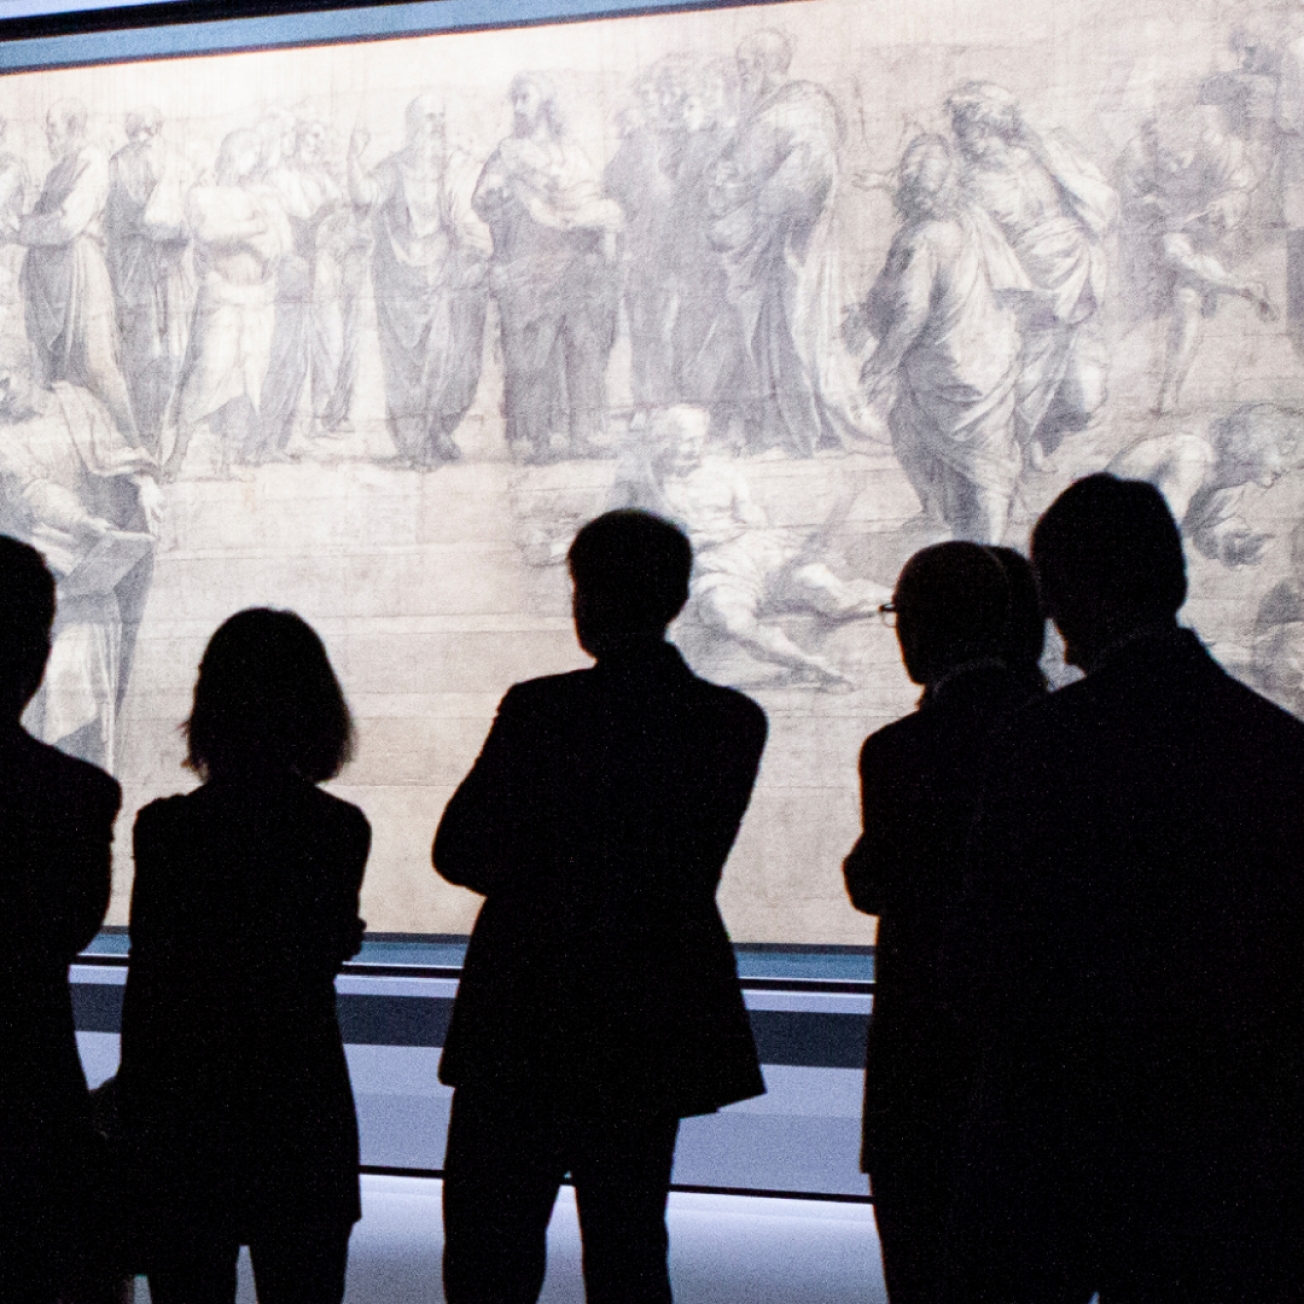
To infinity and beyond.
We started as a small studio based in Milan.
The first works came thanks to the word-of-mouth and long-lived career of our CEO.
Over time we grew: we won some tenders and we became a recognized name in the field.
Today we have crossed national boundaries thanks to the not yet fully explored potential of digital marketing: we count several clients from the rest of Europe and the United States.
A small Renaissance workshop recognized all over the world for the quality of its services.
7. Information design is also a beautiful story to tell.
Beautiful, and useful.
To bring data visualization into companies and organizations, training is needed.
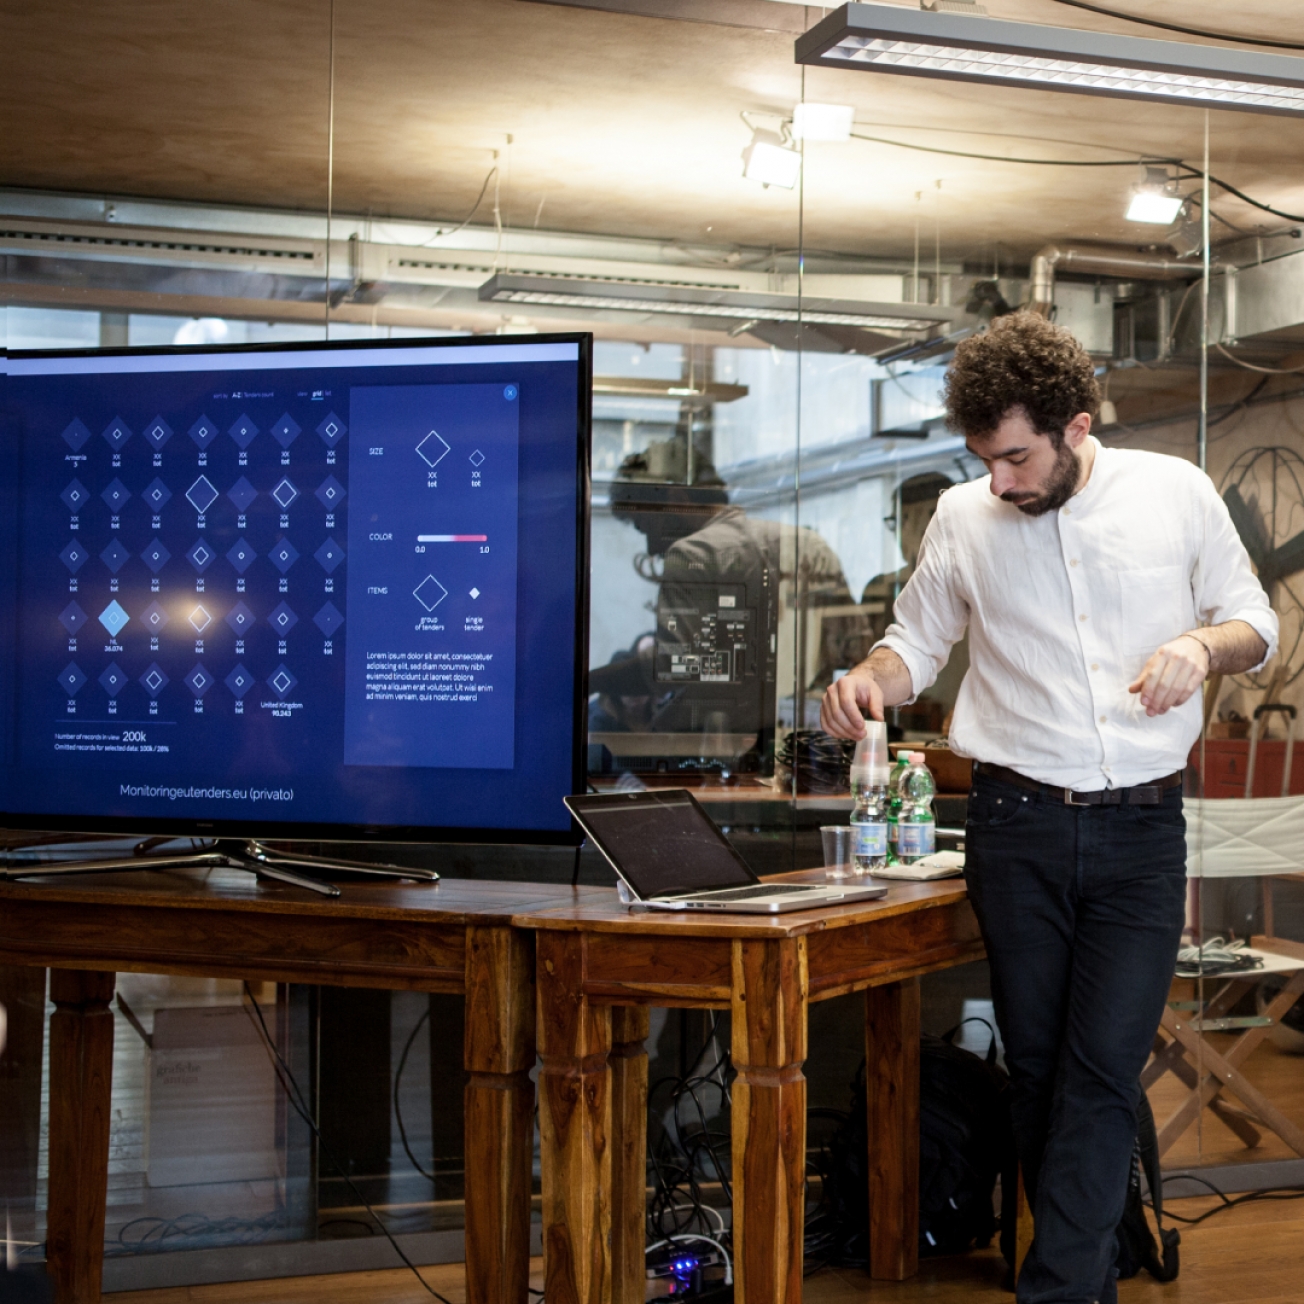
And it is necessary to do it together.
Every project is a starting point.
Every collaboration is the beginning of a journey.
Every opportunity is good to educate on the culture of data.
Sometimes it also happens to join hands and never leave each other, implementing processes of structural transformation of entire departments and companies.
Side by side, hand in hand.
Training then becomes constant, intrinsic to every call, every brief, every round of feedback.
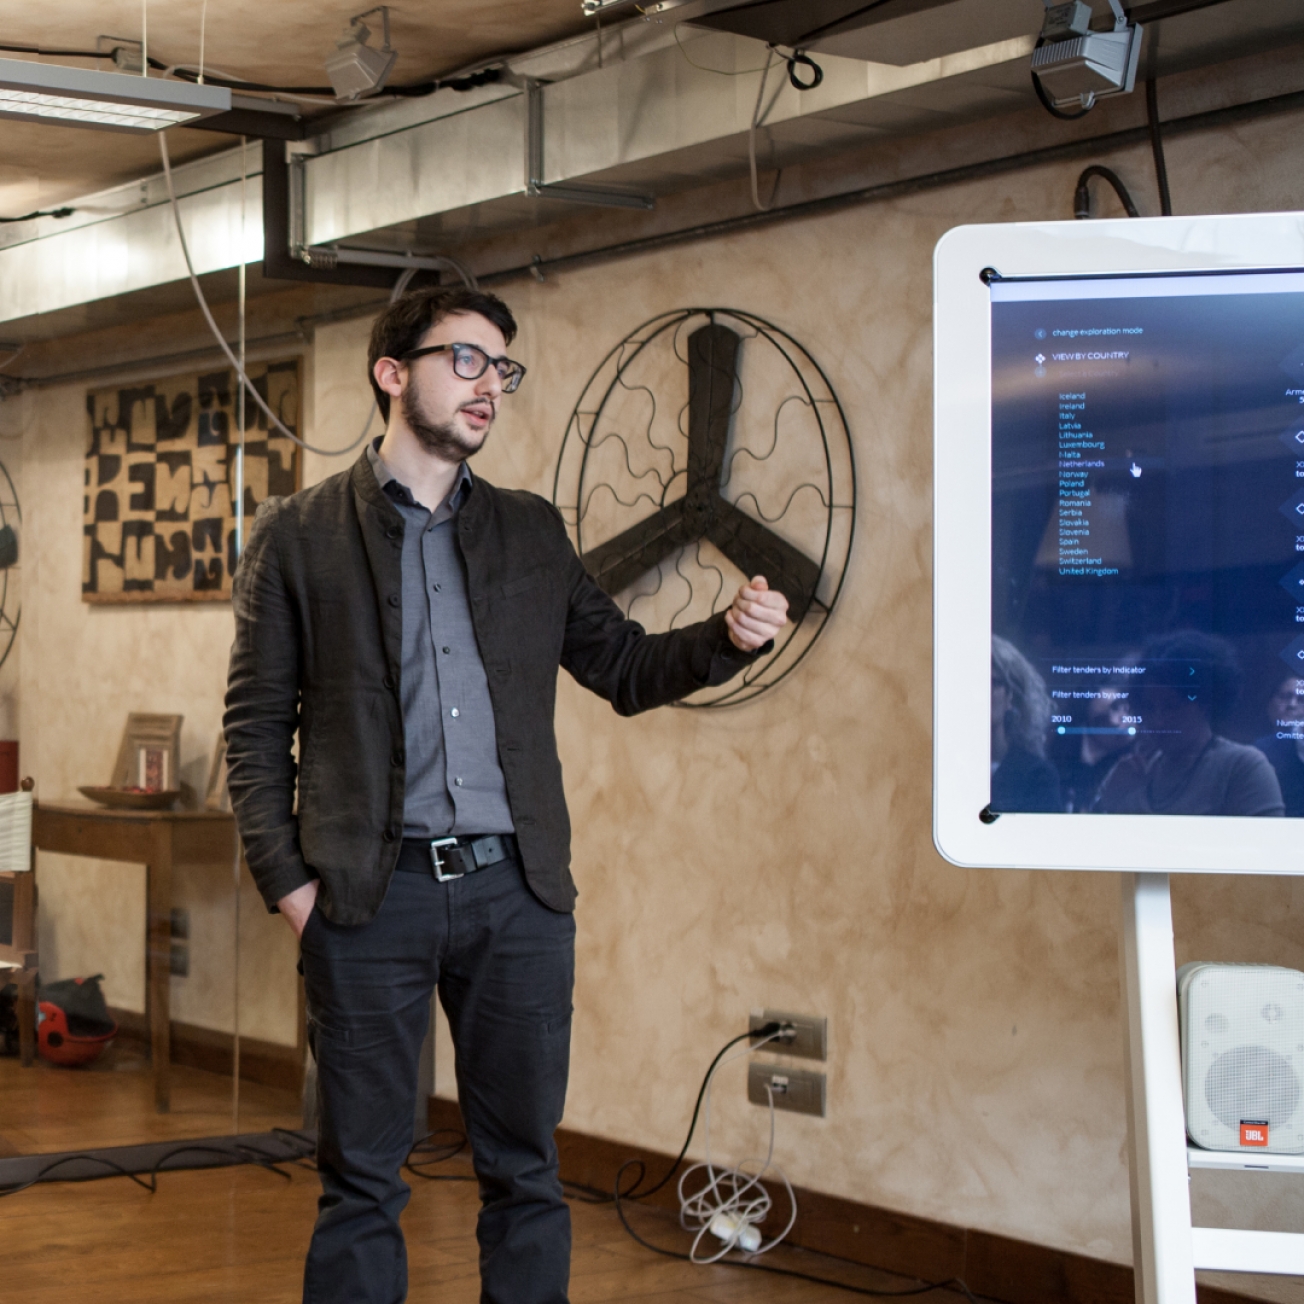
Sometimes it is useful to go back to school, though.
A consulting approach is not always sufficient to educate teams on the proper and profitable use of data visualization.
Sometimes you have to dissect topics, try the techniques in the field, and get your hands dirty.
That is why over the years we have provided tailor-made training courses and workshops.
More than 300 professionals trained, resulting in the birth of Data@work, a three-day intensive course which was a great success.
Like a Renaissance workshop.
We have summarized the basic principles of our design approach. If you are curious,
8. Data journalism: it’s love!
Love for well-explained data, love for quality journalism.
Combining journalism, data and design it is possible to make responsible, informed and conscious information.
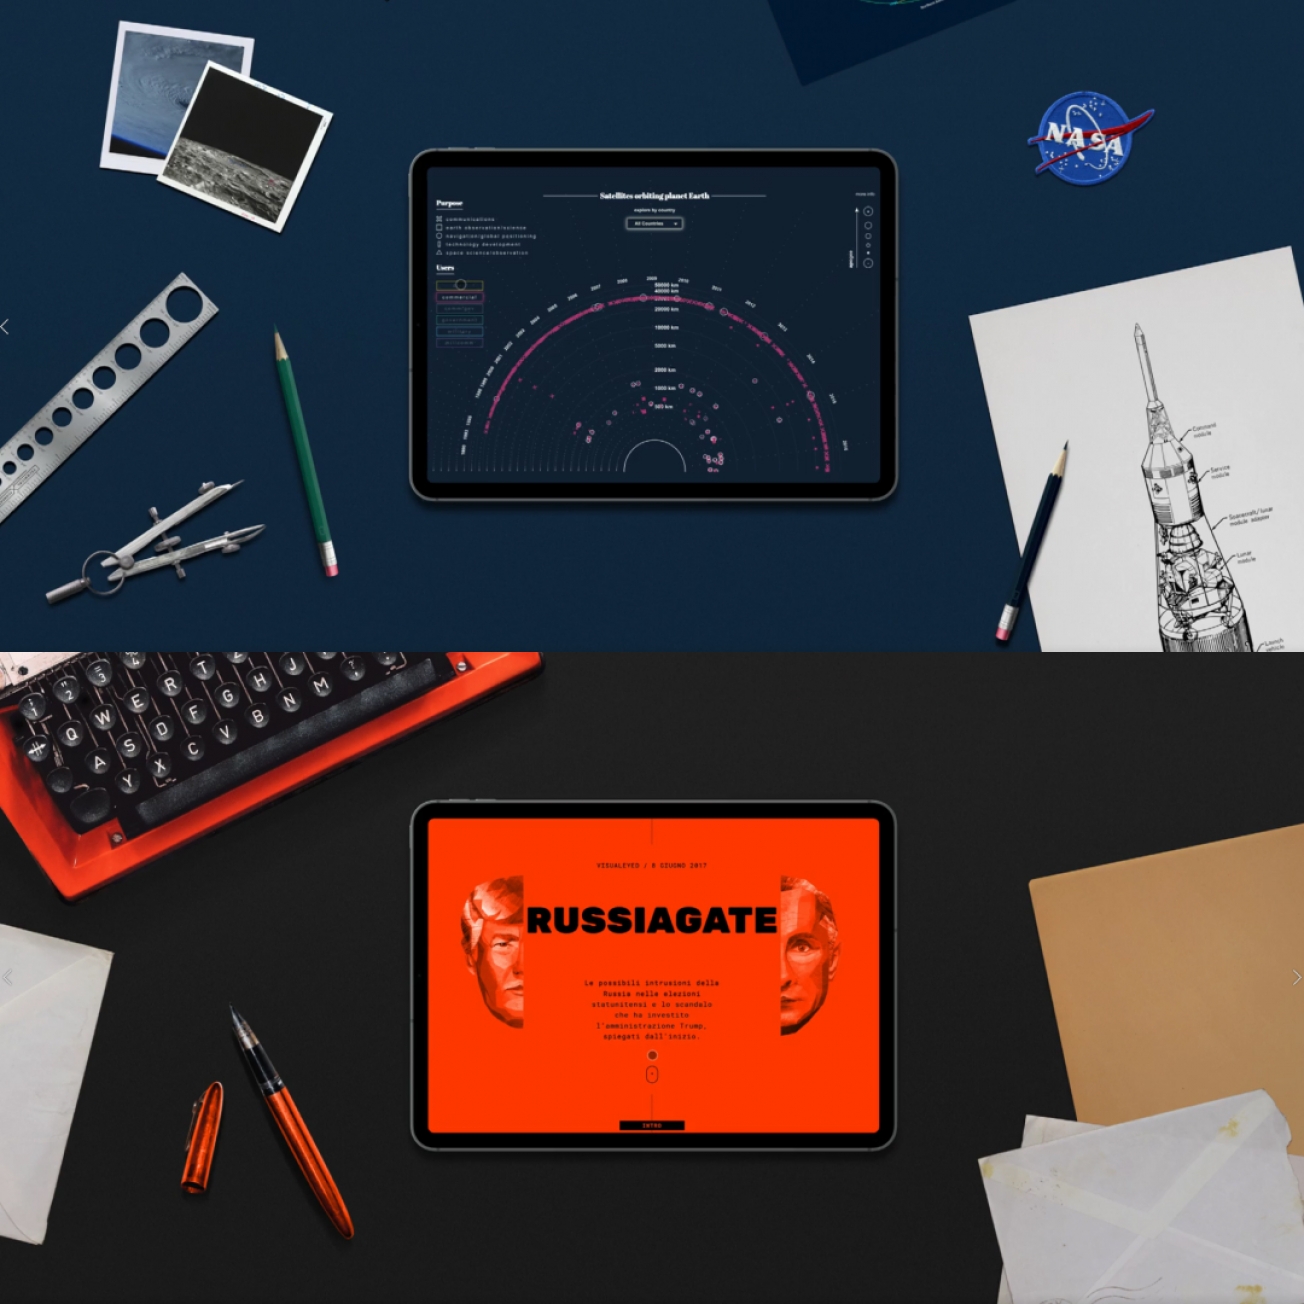
The Visual Agency has always had a side love: data journalism.
Along with business support services, the agency devotes many resources to the production of articles and long forms characterized by a strong data-driven approach.
Taking inspiration from major international newsrooms such as the New York Times, Washington Post, South China Morning Post and many others, Visualeyed was born in 2016.
Visualeyed is an online magazine that presents an interesting mix of original articles and the best examples of data and visual journalism in the world.

From a magazine to a full-fledged specialized agency.
Experience, passion, community service: data journalism represents for us this and so much more. This is why in 2018 we founded its spin-off, Dalk: an agency specializing in the production of editorial content.
Not only for business but also for people.
One of the latest endeavors, which you can find on Visualeyed, is the reportage produced in collaboration with Simone Ferrari, journalist and researcher, on indigenous communities in the Colombian Andes whose survival is seriously endangered by drug trafficking.
9. Here’s to many more of these 10 years
And of these many projects.
In the celebration book, soon to be available as a free download for all subscribers to our Berry newsletter, we have traced the life of the agency year by year, from 2012 to the present, selecting the most significant projects.
In the meantime, we wanted to share with you some interesting ones.
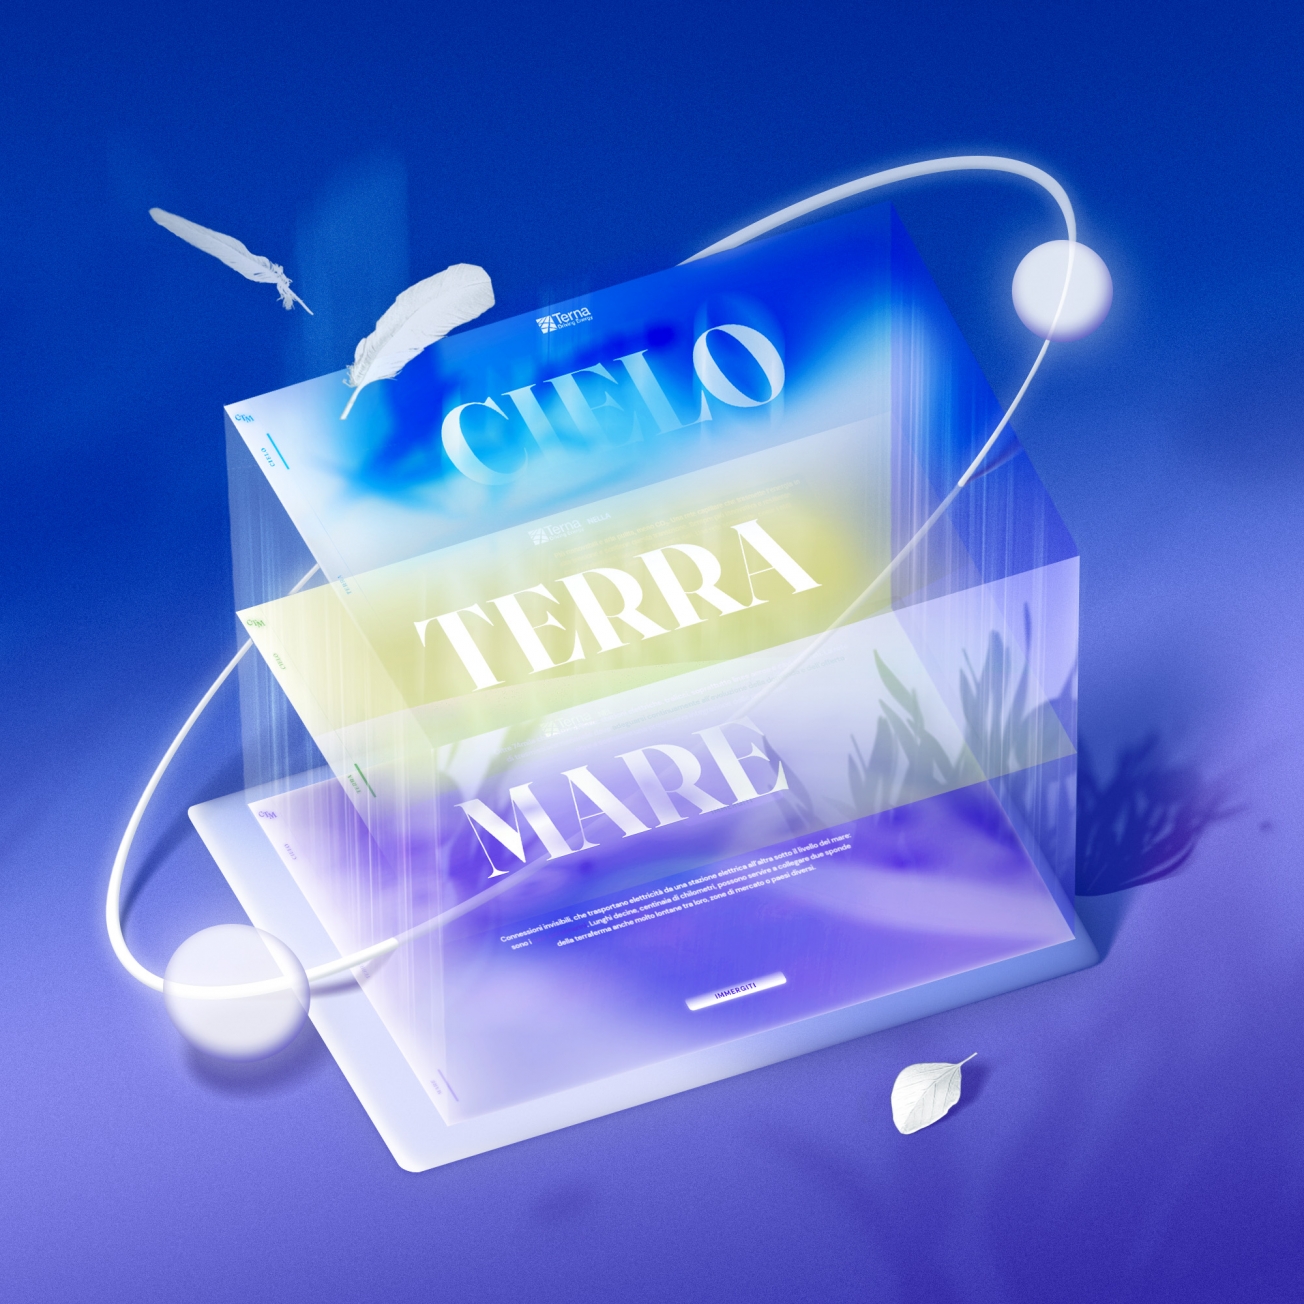
Cielo, Terra, Mare.
An immersive multisensory platform to communicate the works and projects of Terna, Europe’s largest independent electricity transmission operator.
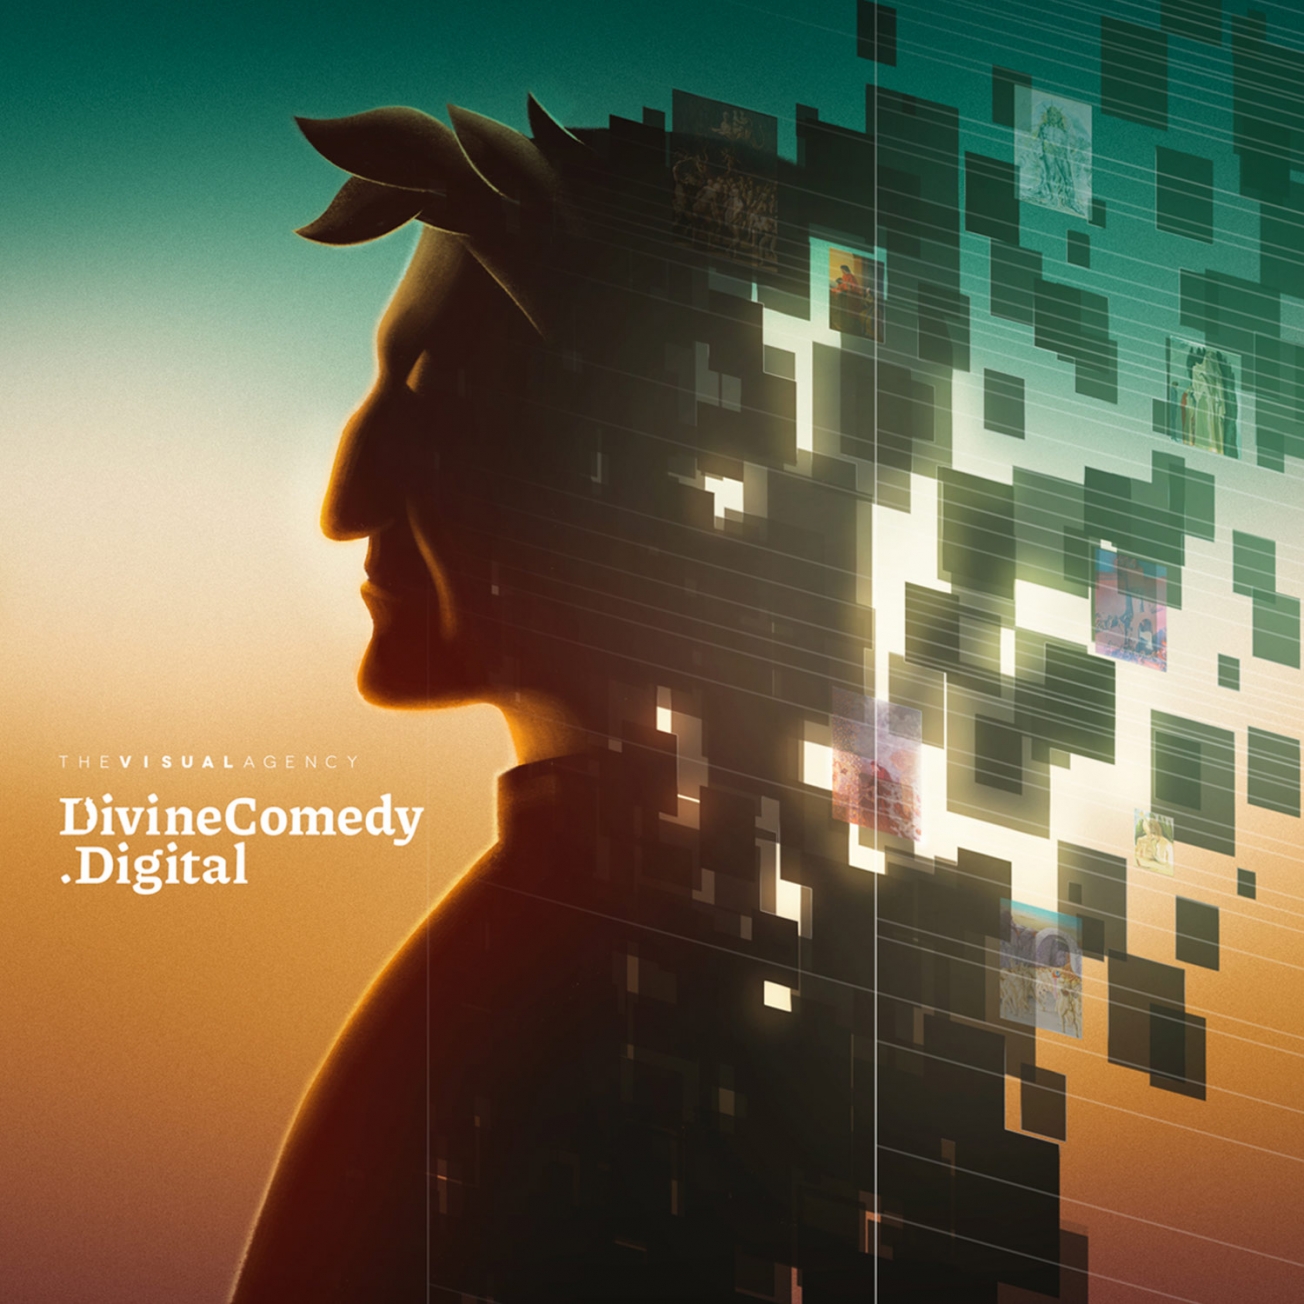
A digital collection to experience Dante’s Divine Comedy.
DivineComedy.digital is a digital humanities project that, for the first time, collects and visualizes the artworks depicting the narrative world of the Divine Comedy. It allows users to explore in a unique and innovative way one of the greatest masterpieces in the history of mankind.
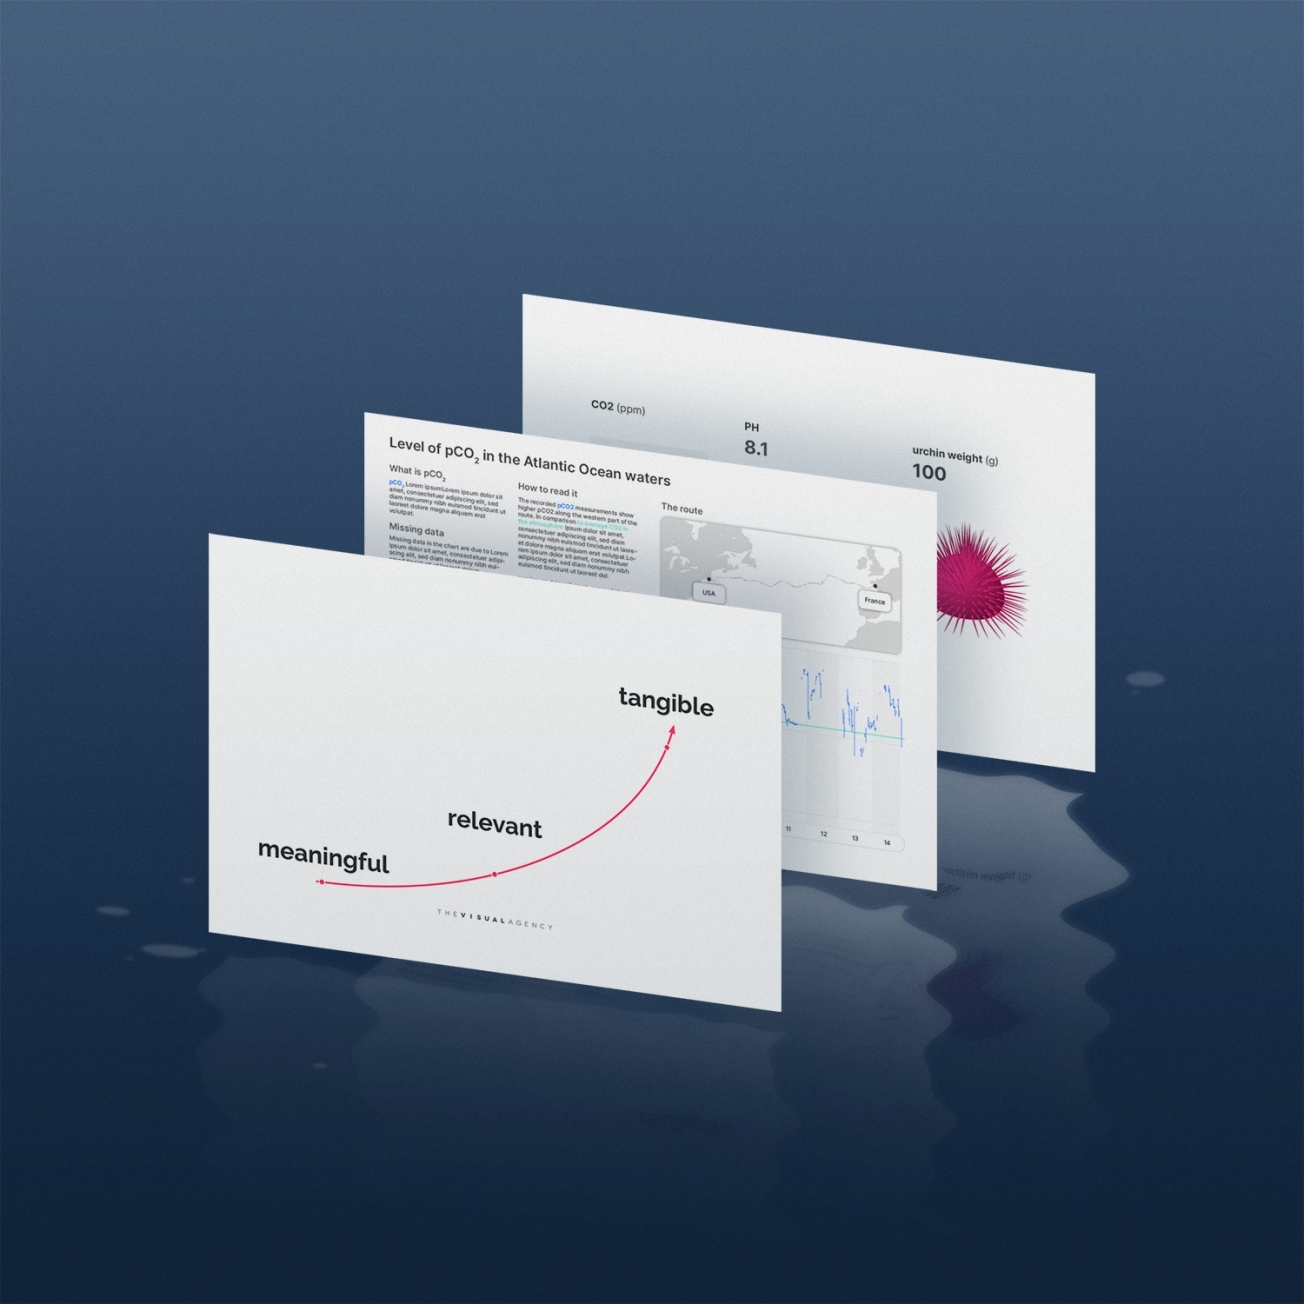
Communicating complex scientific data.
Every three years, The Ocean Race — the longest sailing race in the world — takes place. During this race, the yachts are used to carry out important scientific research activities focused on the health of our oceans and the impact of climate change and human activities such as pollution and overfishing.
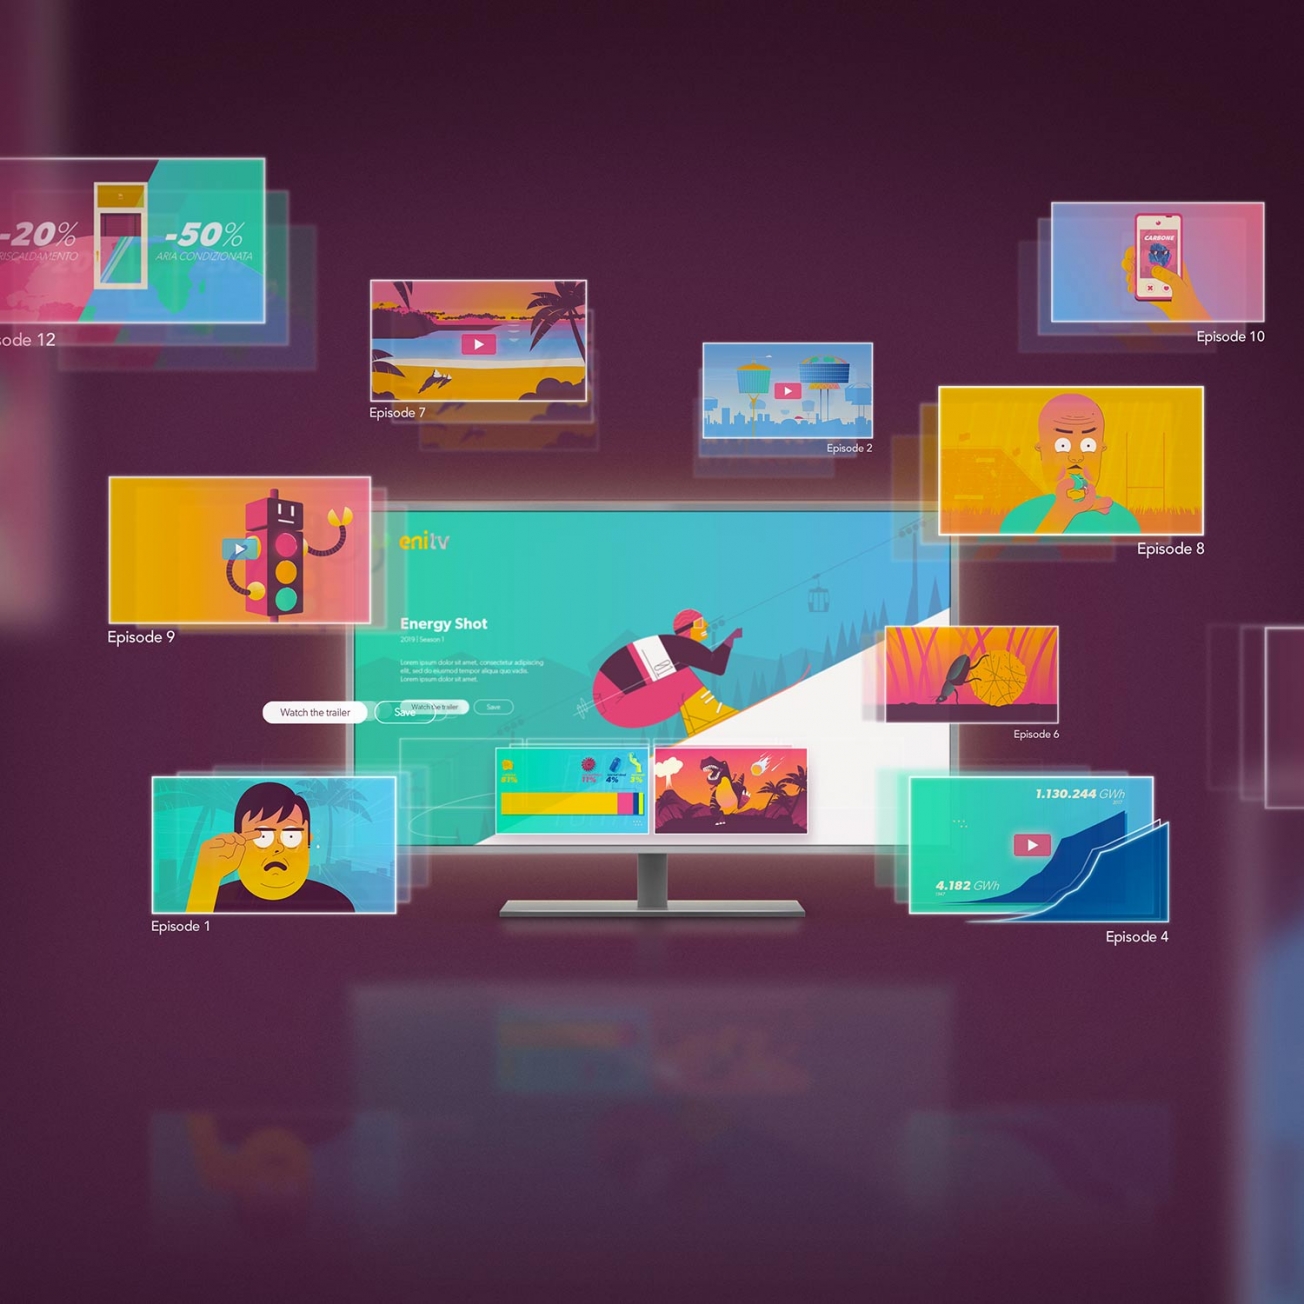
Energy Shot: An ongoing TV series about Energy.
Energy Shot is a data-driven series about technology, trends and curiosity that lie behind energy making.
10. The Future as seen from here
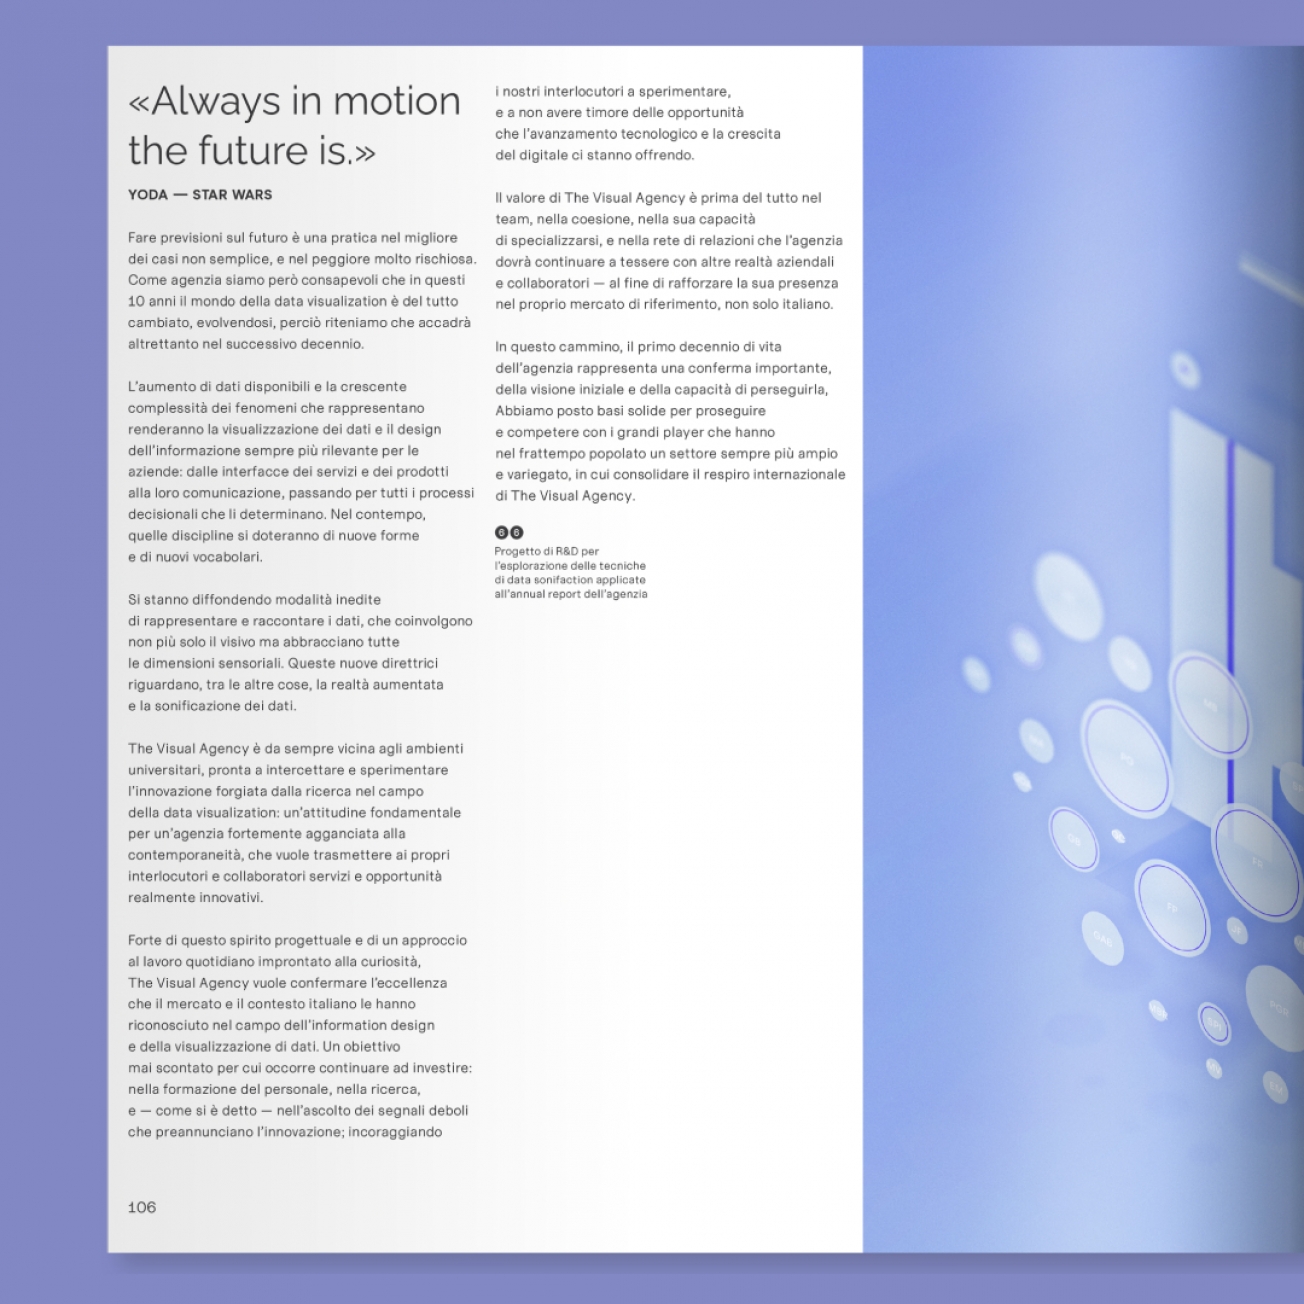
«Difficult to see. Always in motion is the future.»
Any day now, the celebration book will be available to all those subscribed to Berry, our monthly newsletter. In the meantime, we have been wondering what the future of data visualization will look like.
While making predictions is as difficult as it is risky, after ten years of experience in the field of information design and data visualization we can not help but reflect on how these disciplines will evolve in the near future.
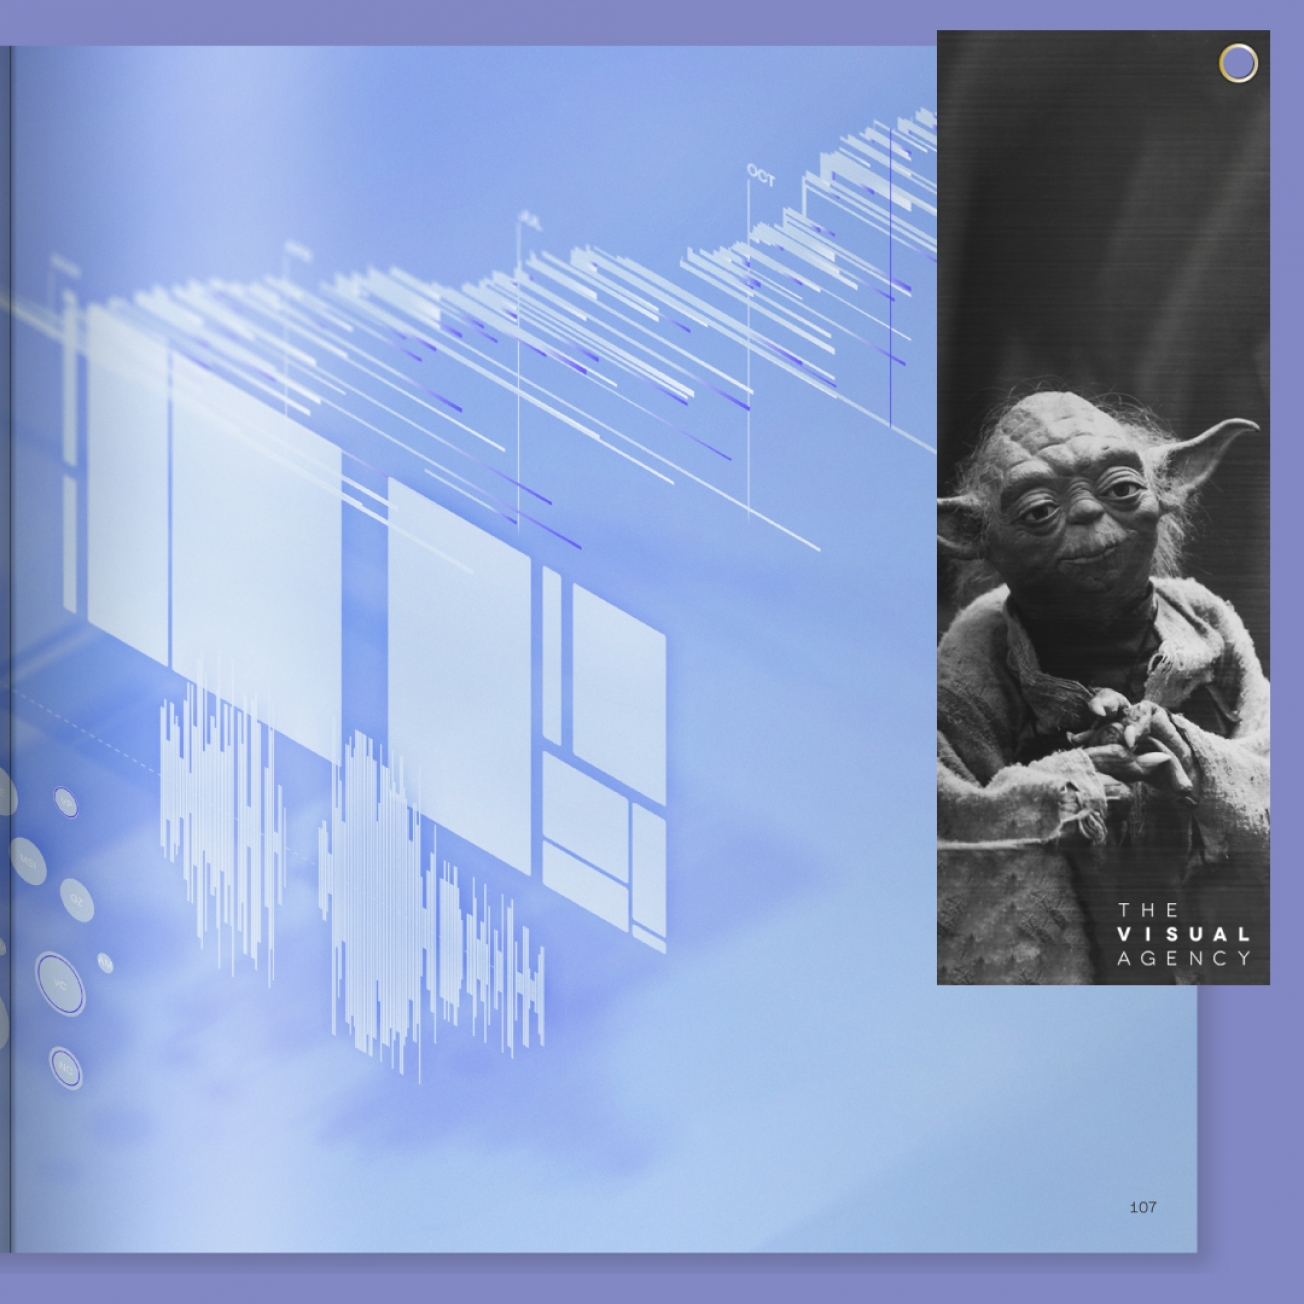
New languages, formats and supports.
The history of data visualization moves hand in hand with technological progress. It began with static and analogic, it moved to interactive and digital, but how will data visualization adapt to new technologies?
The way data is represented and communicated is changing rapidly, increasingly involving multisensory dimensions: data sonification, augmented reality, and virtual reality are already a solid reality.
More data, more opportunities.
An estimated 79 Zettabytes of data were produced in 2021, and this figure is expected to more than double by 2025 (International Data Corporation).
Just to give an idea, every minute 65,000 photos are posted on Instagram and 5.7 million Google searches are made.
With such an immense amount of data, it is increasingly more complex and multifaceted for companies and organizations to approach all this information: from the product interfaces and service and their communication to all the decision-making processes that determine them.