Communicating complex scientific data
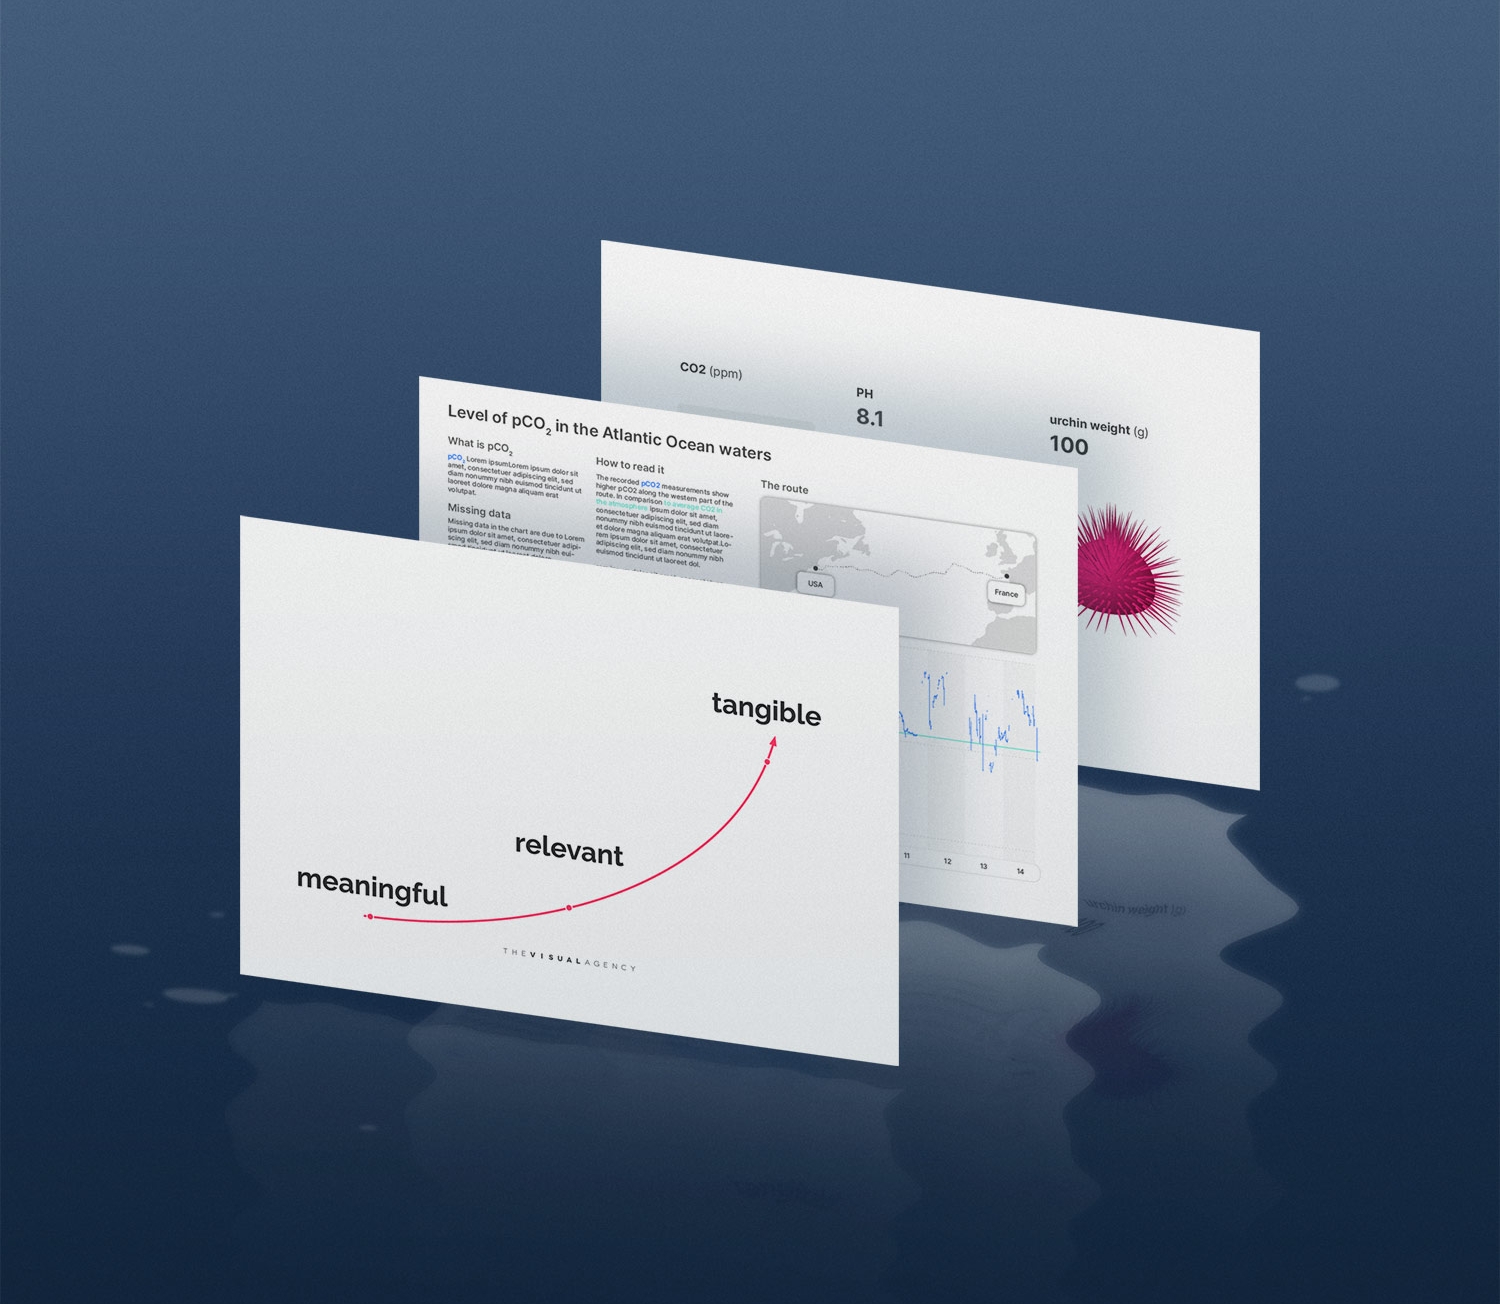
- Communicate with a wide audience
- Learn how to effectively communicate with data
- Raise awareness about ocean health
Explore the project
Every three years, The Ocean Race — the longest sailing race in the world — takes place. During this race, the yachts are used to carry out important scientific research activities focused on the health of our oceans and the impact of climate change and human activities such as pollution and overfishing.
The data generated during the race needs to be externally communicated to a broad audience in order to raise awareness about the ocean health and the work of The Ocean Race in this space.
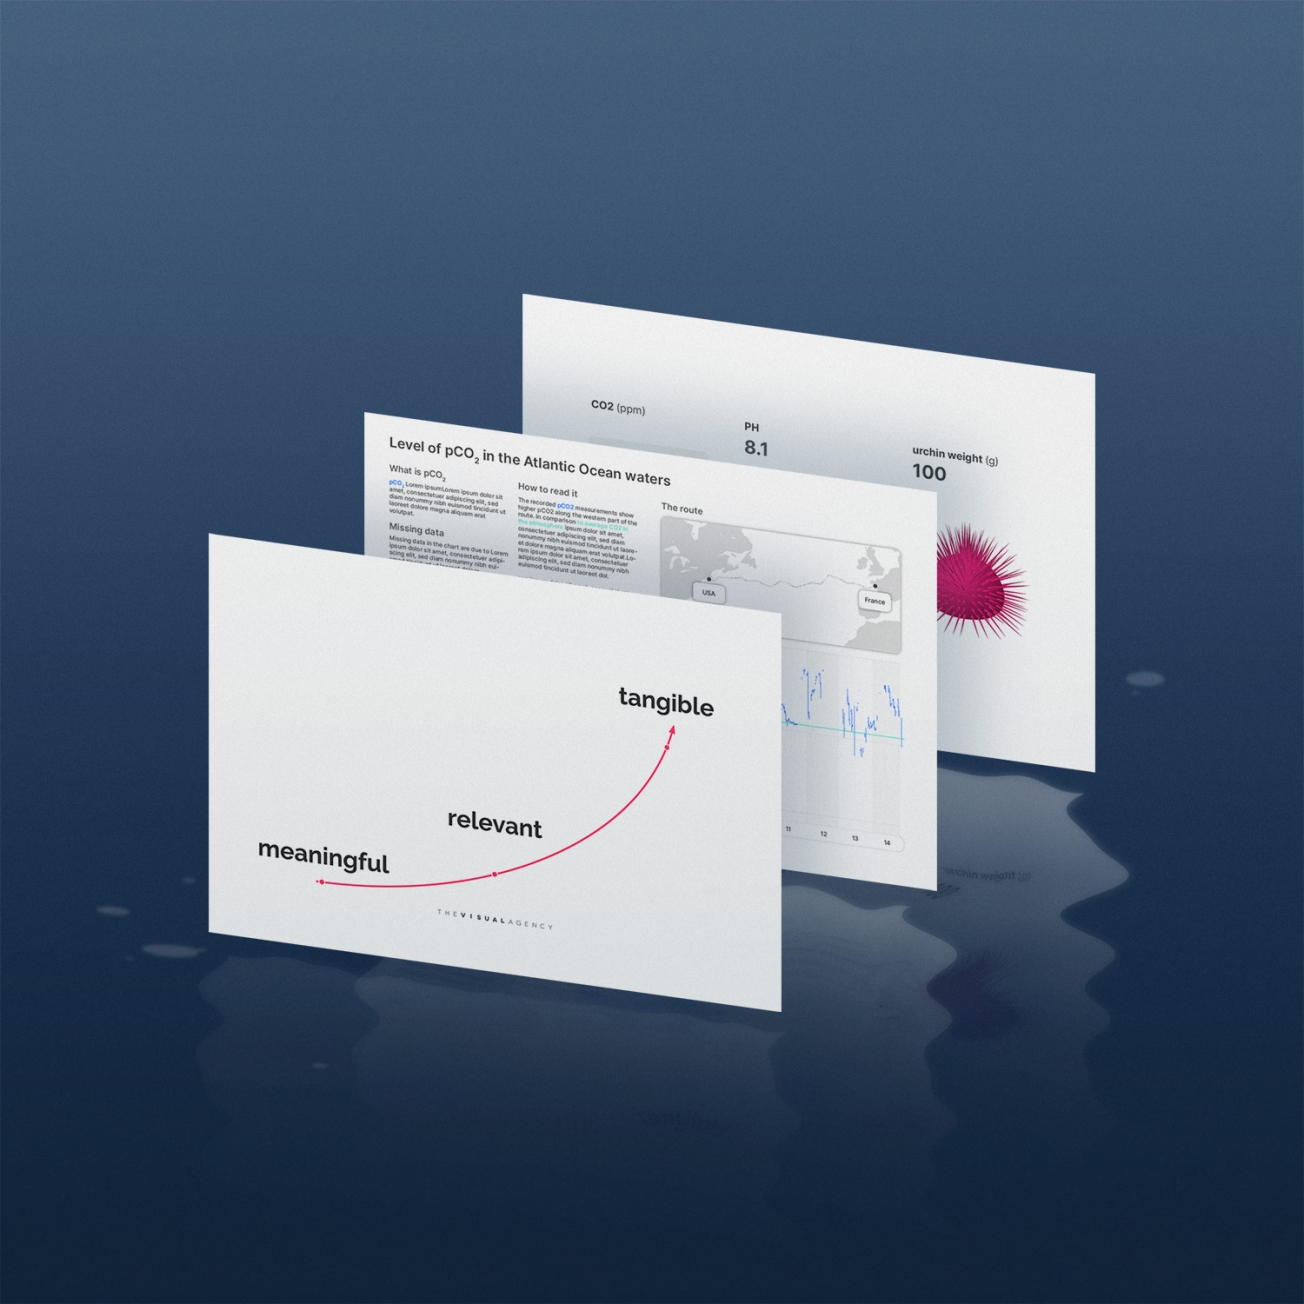
Data-driven scientific communication
As part of “The Ocean Race Innovation Workshop”, The Visual Agency led its own dedicated workshop on how to design impactful, data-driven communication. The workshop was attended by a cross section of stakeholders with different professional backgrounds, such as scientists, journalists and professional sailors. The diverse competences of the attendees, combined with The Visual Agency’s expertise in information design and data-visualisation, have led to insights that can be used as a guideline for efficient data-led communication of oceanographic data.
The process
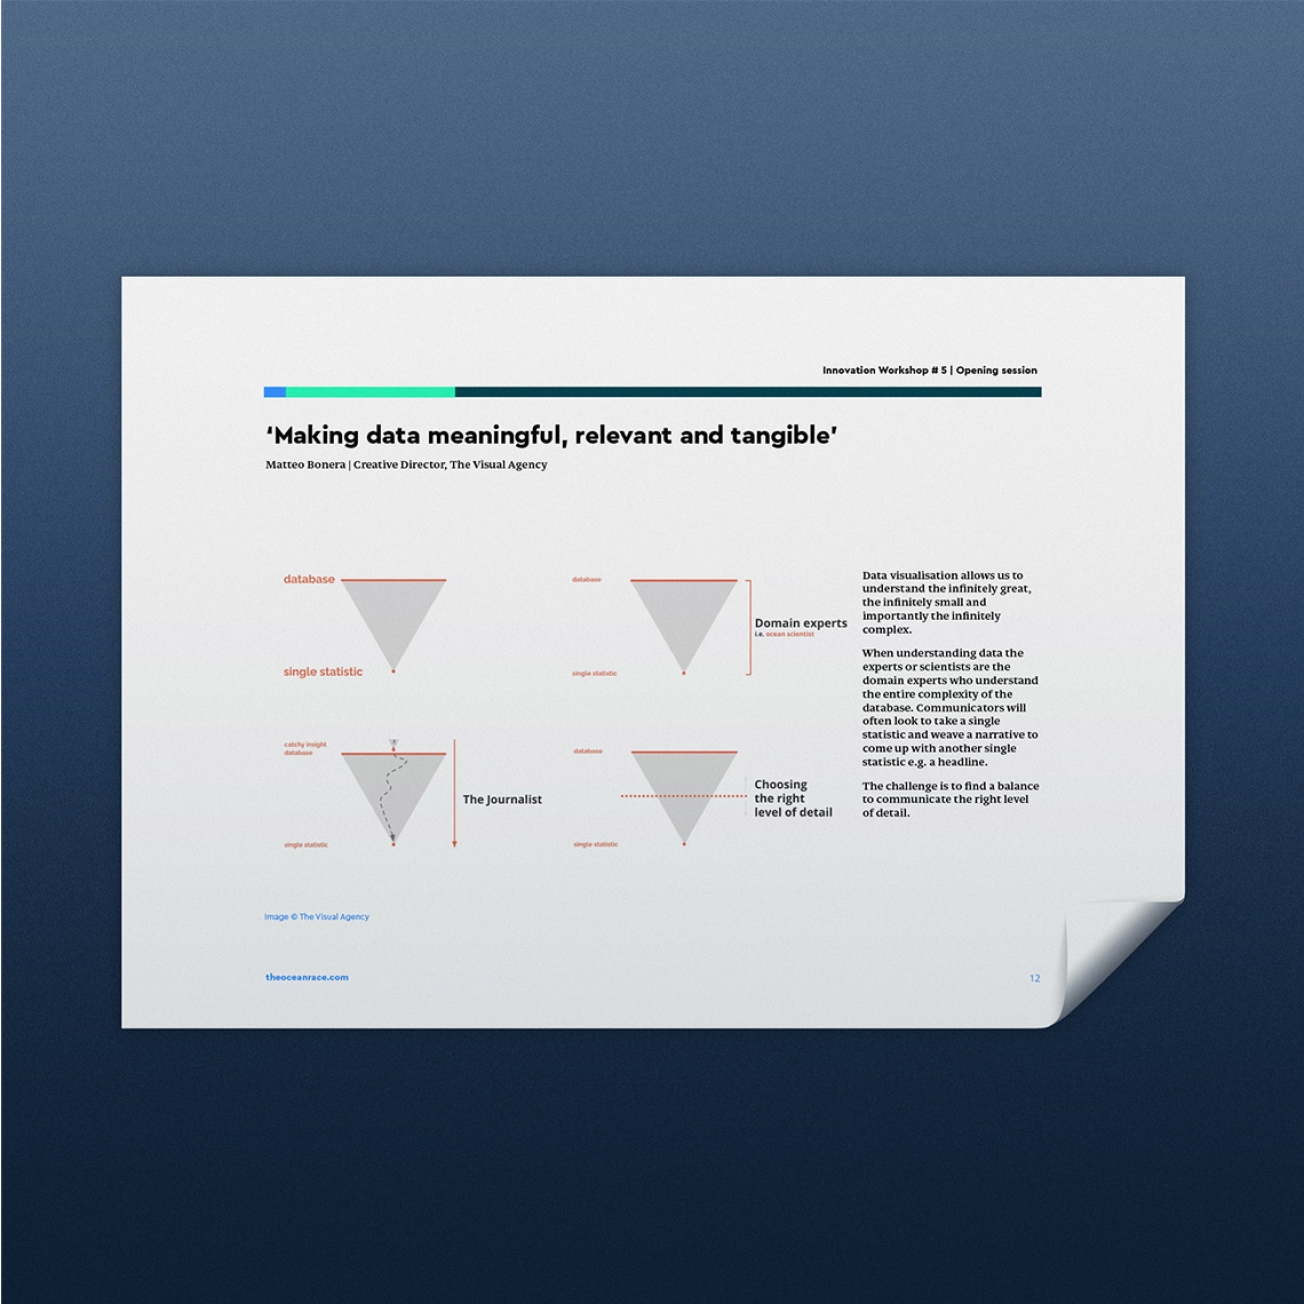
In a plenary session lecture, The Visual Agency’s Creative Director Matteo Bonera gave examples of how to make data meaningful, relevant and concrete in order to create the best, most engaging and insightful communication tool possible. His intervention set the stage for the following workshops and breakout sessions.
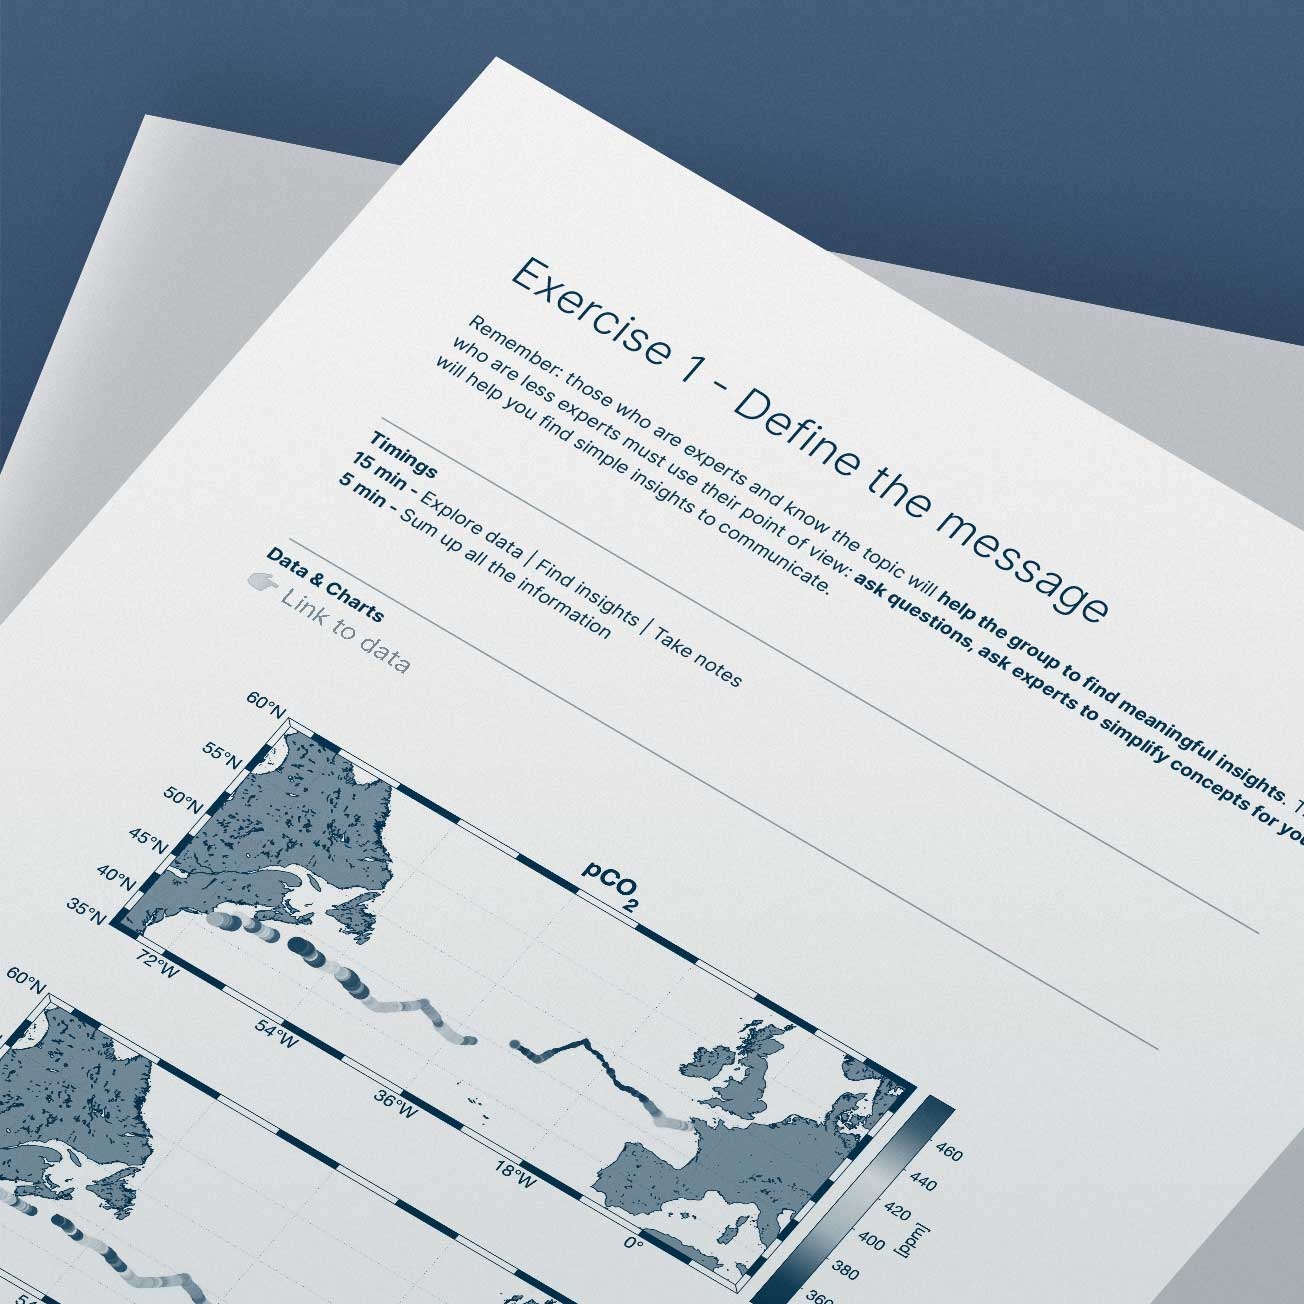
Workshop: Ocean & Science - How to Communicate Ocean Science with Data
The workshop was based on interactive exercises and guided discussions, with a workshop leader and supporting staff. The aim was to define the different elements of the communication process for a specific example of dataset and find recommendations on how to approach oceanography complexity, so that data could be translated into meaningful stories and impactful communications for a diverse, non-scientific audience.
The report
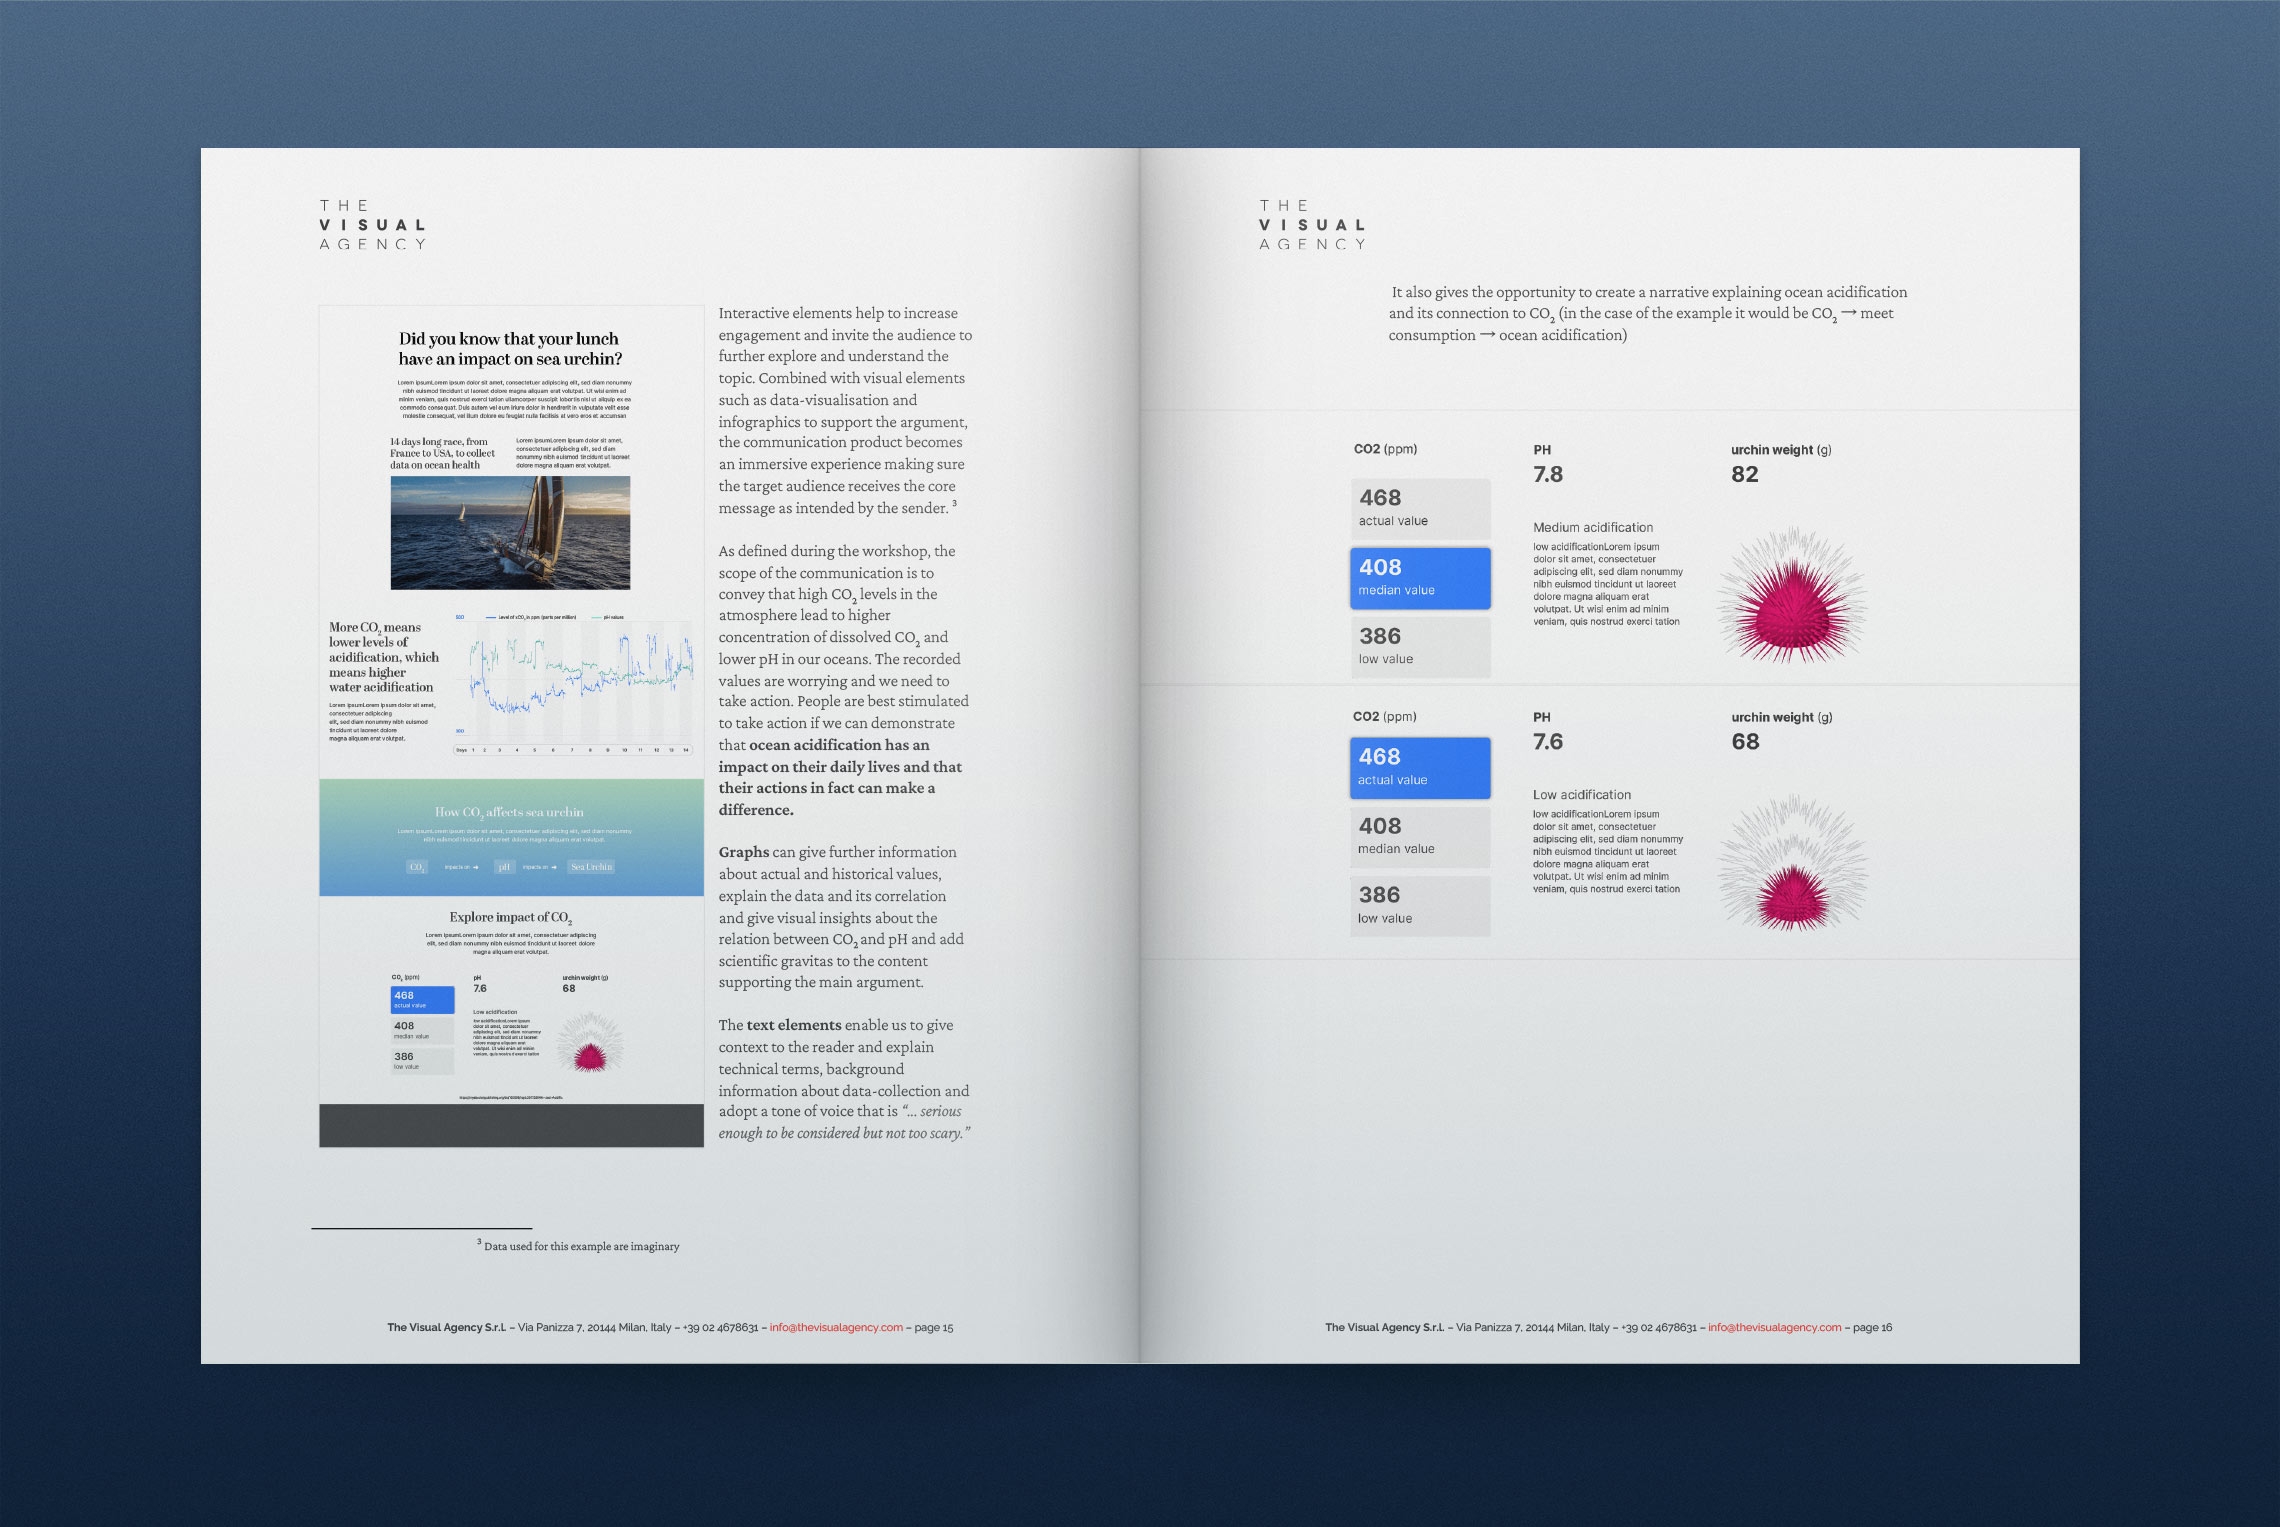
The participation of diverse personalities significantly contributed to produce some essential insights. The Visual Agency applied these insights to a real-life example to show that data visualization and information design can be fantastic tools for creating communication products, as they facilitate the communication and understanding of complex scientific topics, increase user engagement and foster an active response through the user experience and narrative they create.
The results, recommendations and insights were collected in a report that was compiled by the Ocean Race to give guidance and share knowledge with their various stakeholders.
