element('Site/iubenda-cookie')?>
Solutions Dashboard and Data Visualization

Our Solutions for Dashboards and Data Visualization

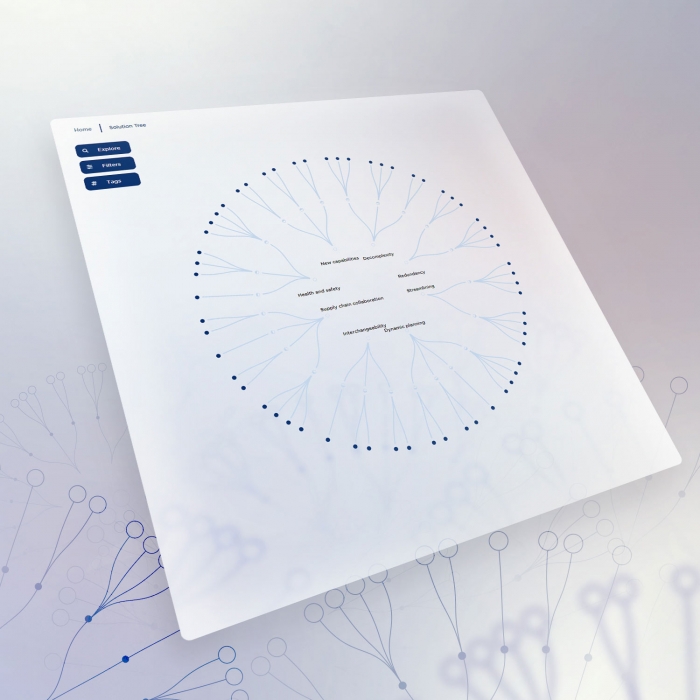
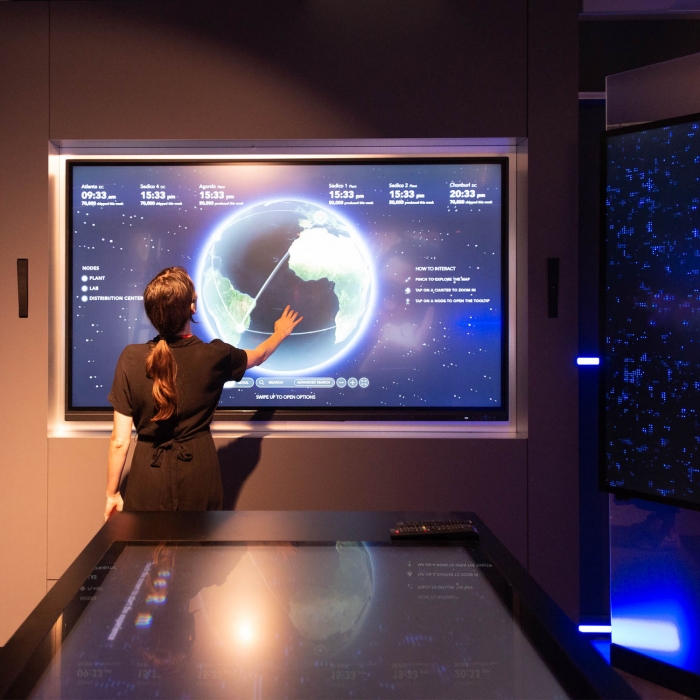
Well-designed data-driven dashboards provide users with real-time access to insights, presented through effective data visualization, which allows for informed decision-making and strategic planning.

Data Visualization and Storytelling in Dashboards

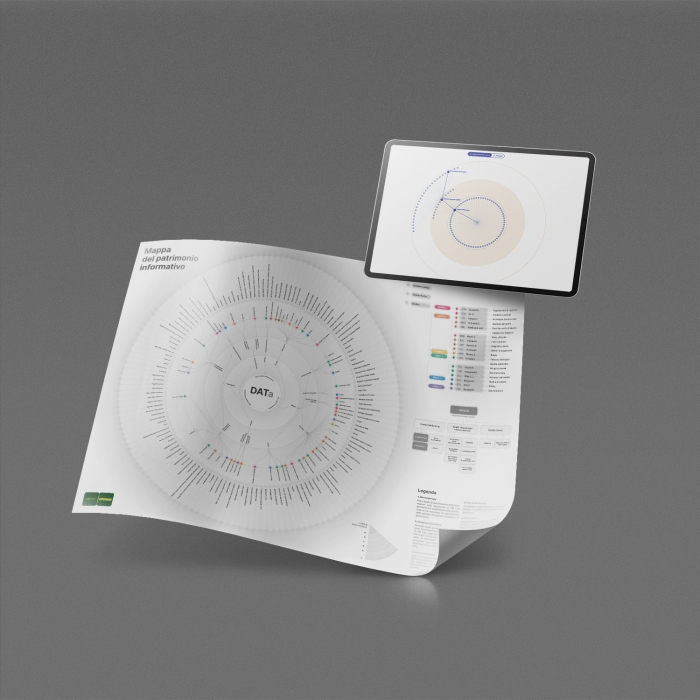
The integration of data visualization and storytelling within dashboards enables businesses to transform raw data into meaningful narratives. This approach allows users to discern patterns, anomalies and trends, enhancing their ability to make informed decisions based on the data presented.

How to Design a Dashboard for Effective Data Visualization

The design of a successful dashboard necessitates a deep understanding of both qualitative and quantitative data.

At The Visual Agency, we specialize in data visualization design, ensuring that our dashboards are both highly functional, accessible by design and visually appealing, facilitating ease of interpretation for a wide range of users

The Visual Agency brings extensive experience in accessible dashboard data visualization across industries such as media, energy, life sciences and fashion.

Whether you're looking for guidance on how to make a dashboard or seeking inspiration from dashboard visualization examples, we offer tailored solutions that align with your specific goals. Our process includes conducting workshops to gather stakeholder input and developing a clear information architecture to ensure the dashboard is both functional and scalable. With a focus on UX/UI digital design, we ensure an intuitive user experience, supported by rigorous user testing to refine functionality. Our dashboards not only provide actionable insights but also promote efficient and sustainable data management practices.
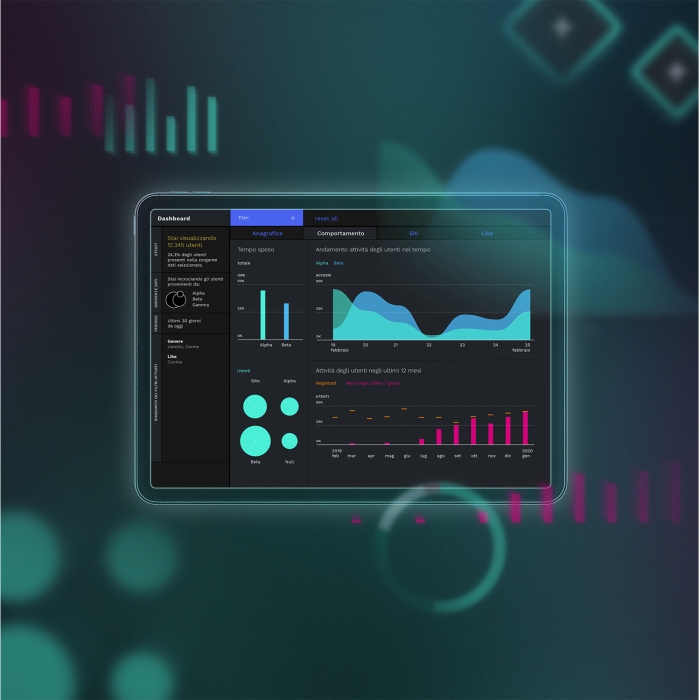
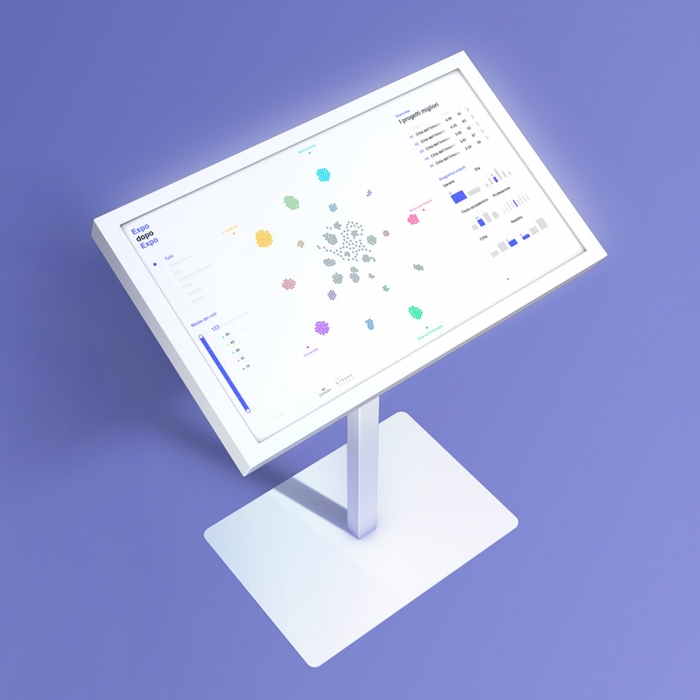
Our approach entails

Together with you, we analyze the data/information, users, purpose and technical aspects of the dashboard in structured kick-off sessions.

We analyze your brand guidelines and creative framework.

We create a design concept for you to review and confirm all design elements.

We advise and provide consultancy on how to best visualize the data/information at hand.

We apply our know-how in the fields of information design and data-visualization to create scientifically correct and appropriate data-visualizations for the end-user.

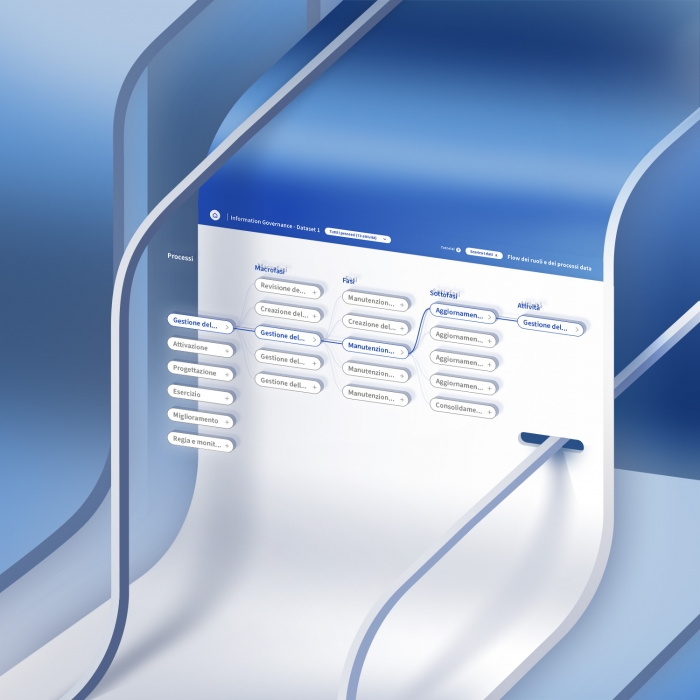
We create a wireframe to demonstrate the layout and logic of the dashboard.

We create an interactive mock-up of the dashboard for user testing and client approval.

Once the mock-up is approved we develop the front- and back-end of the dashboard accordingly.

Tutorial production for users and onboarding.

We deploy the dashboard to you and guarantee 1 year of maintenance after delivery.

See more...
Client benefits

Structured activities to capture all of your needs and KPIs.

Collaborative approach to avoid scope-creep.

Multi-device development.

User testing activities to create the right dashboard for the right purpose and user.

UX/UI design applied to your dashboard for intuitive user-experience.

Information design consultancy and data-analysis for powerful analytics and visualizations.

Design, front-end and back-end services all in-house.

Deployment of the dashboard directly to your system environment.

No licence fees attached.

See more...

Case studies

Get in touch for more information

Contact us
TVA News
Nimbo

Nimbo

Animated data-driven videos to raise awareness about air quality. Tap into the power of video automation.

Discover Nimbo