Oxway
Exploring the question: what's next for Milan's Expo area?
Client benefit
Public Education & Information - Visualize qualitative research for the general public
Project objective
Project results
Project background
Explore the project
Visualization of the proposals and vote results of a public opinion study on what to do with the spaces of the EXPO area after its conclusion.
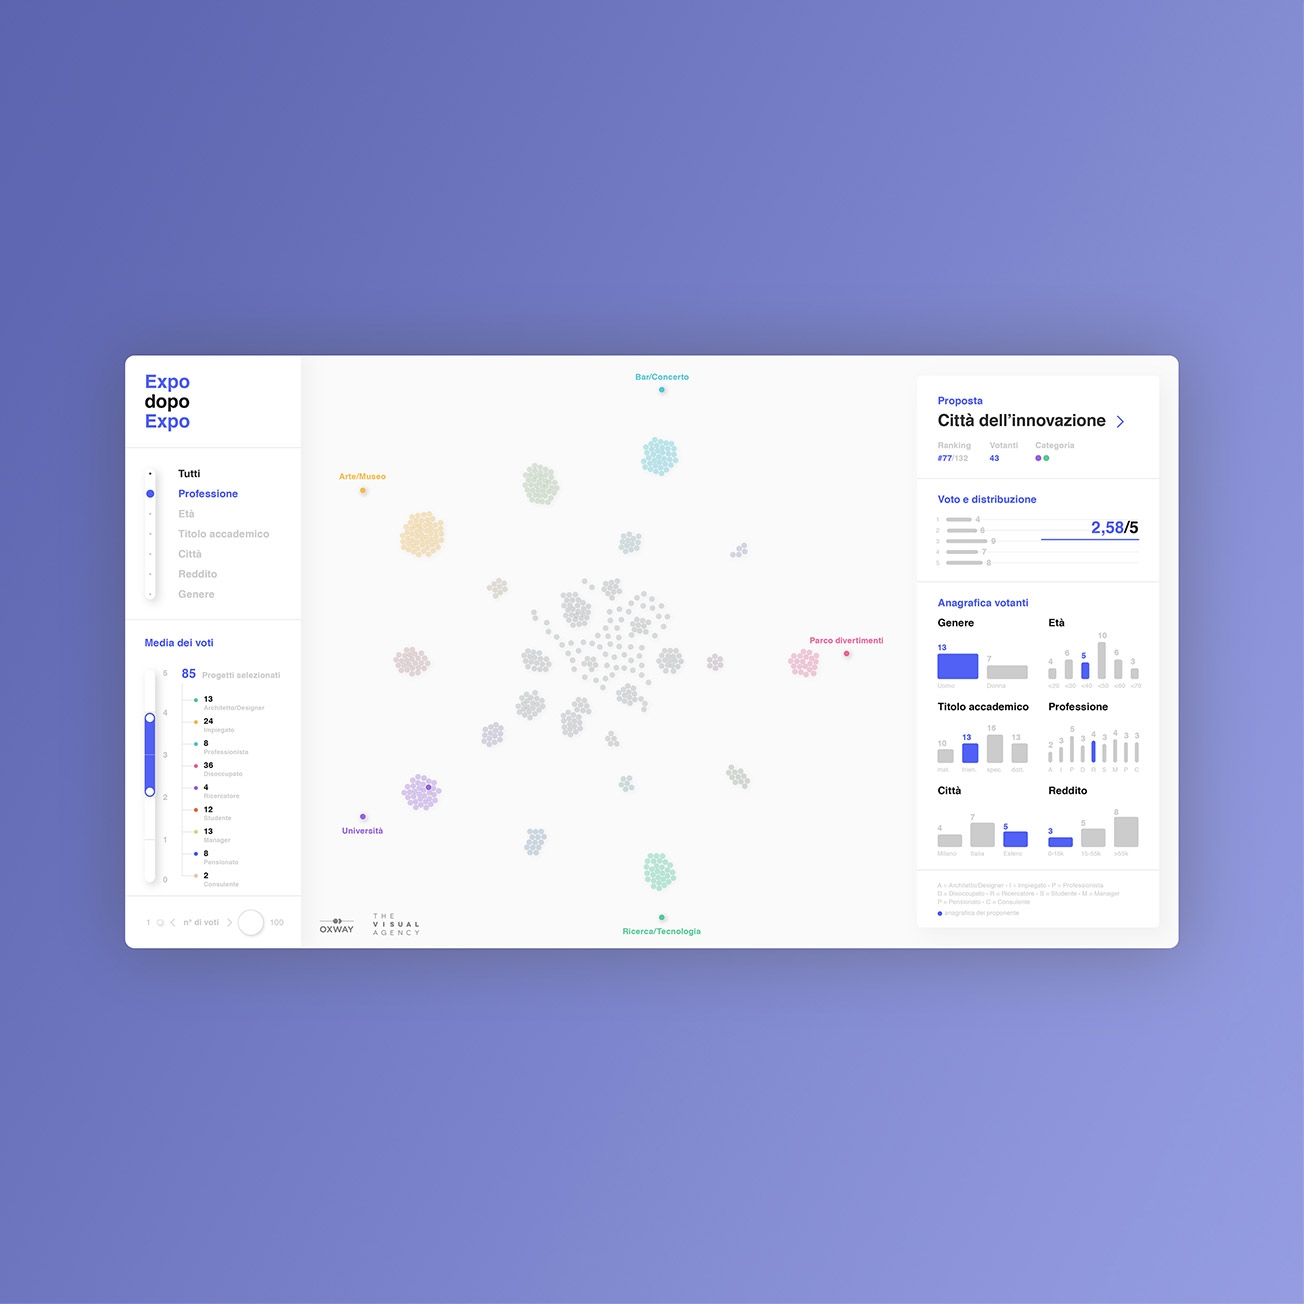
The interactive dashboard
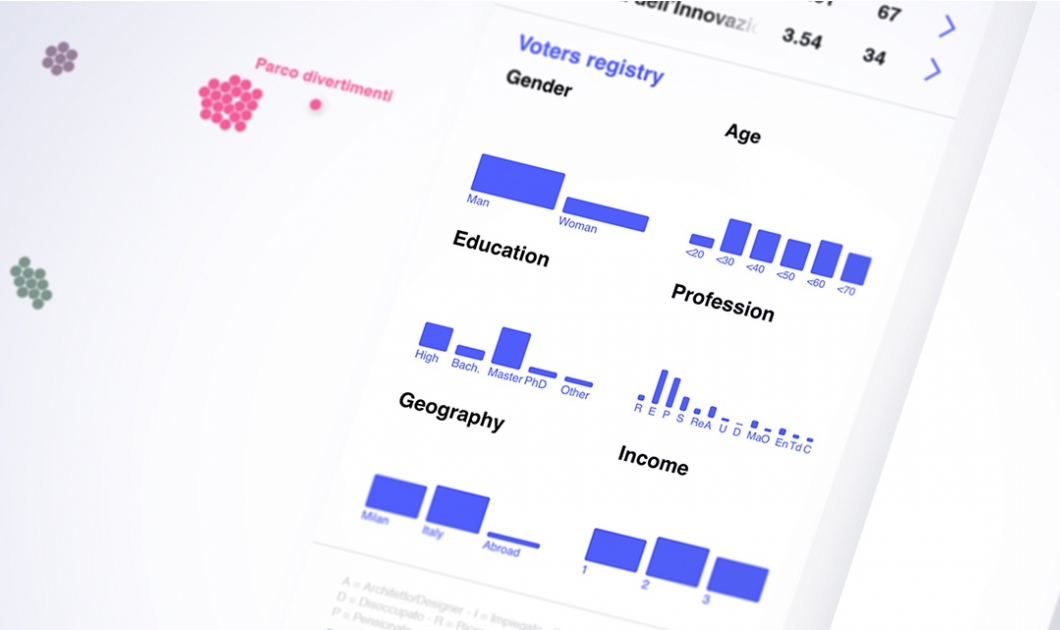
Users can explore and analyze each of these answers to determine the public’s preference for the future of the EXPO Milan area.
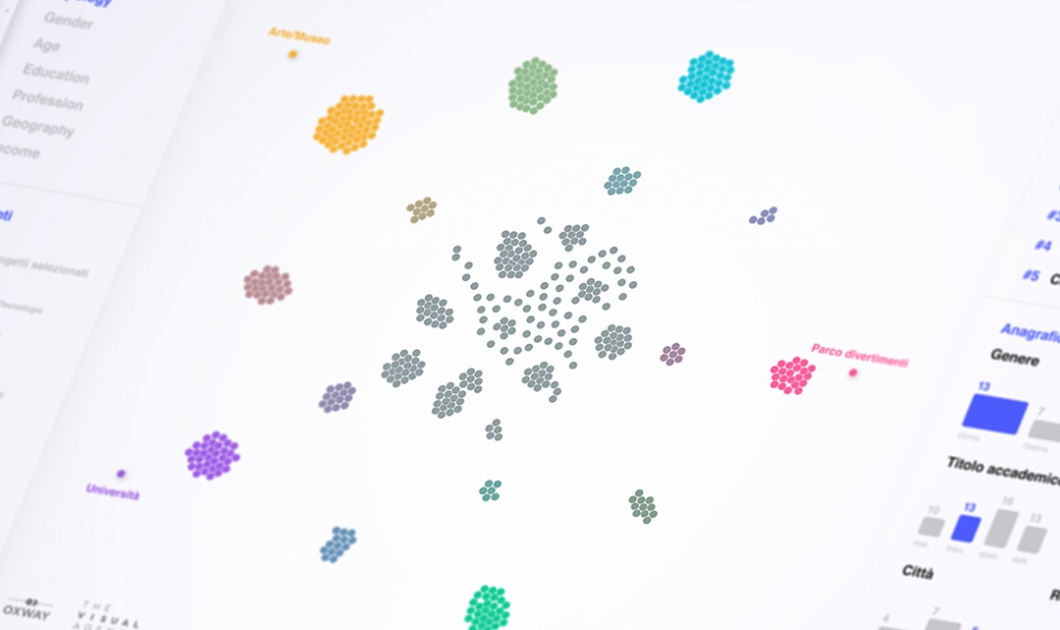
We designed an interactive application which allows the user to explore and analyze every single open-ended response through organization of answers into topical clusters according to socio-demographic criteria.
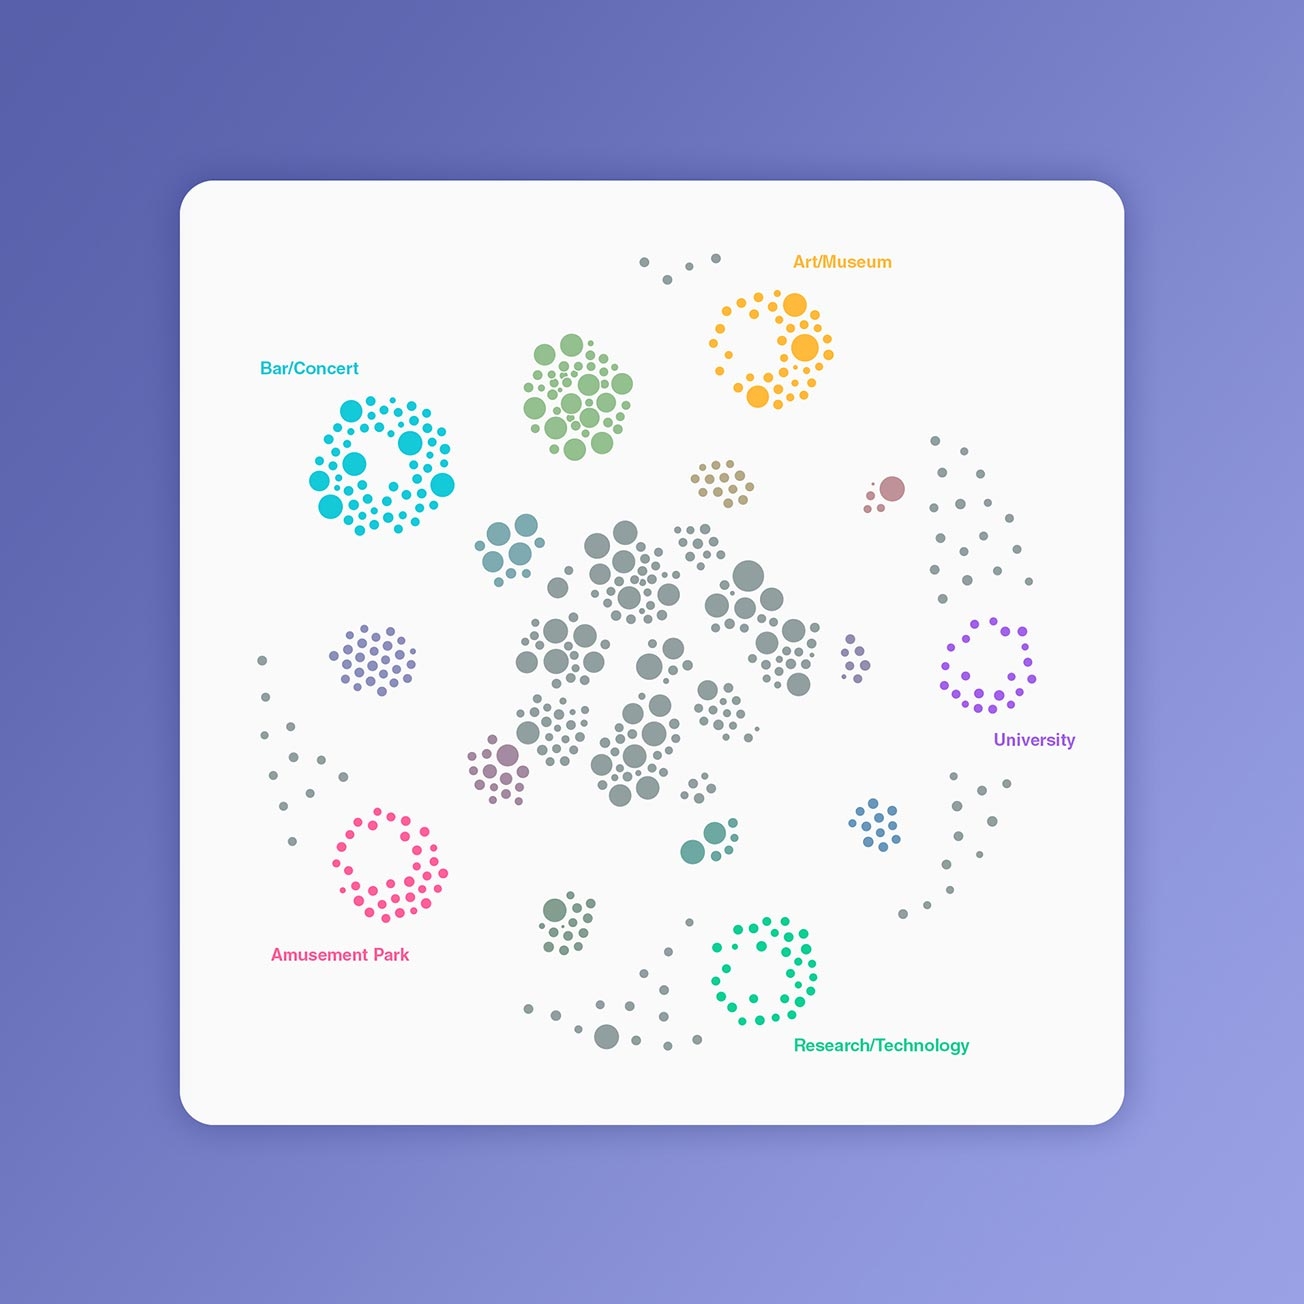
The visualization module
Every circle represents each one of the 977 proposals.
Its position relates to its affinity with one or more of the 5 macro-categories.
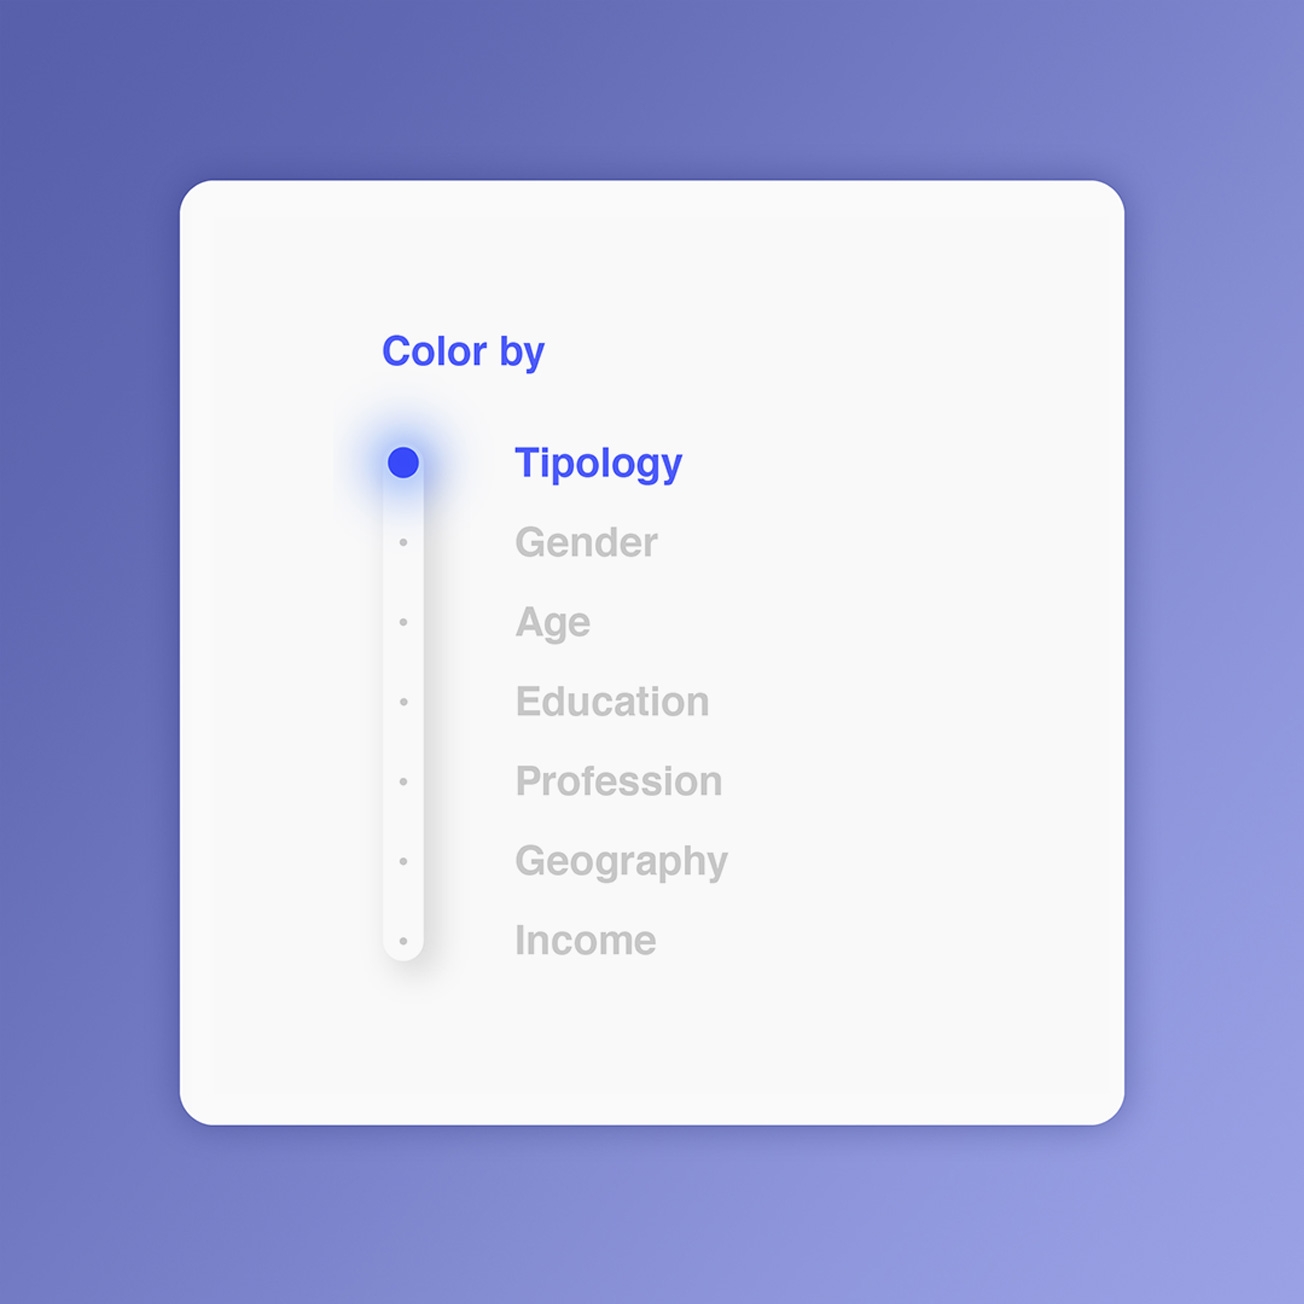
Filtering the view
Results can be filtered through different parameters.
The data complexity is then translated into a color scheme.
