Client:

Biblioteca Ambrosiana

Solution:

Dashboards and data visualization

Decoding Leonardo Da Vinci for the world

Description

Background

For the 500th anniversary of Leonardo Da Vinci’s death, the agency pioneered a data visualization initiative to make his Codex Atlanticus digital. Internationally awarded, this website opens up this artistic heritage to the world. The public can browse through and explore the entire content of the Codex page by page.

This project has been created in collaboration with the Biblioteca Ambrosiana in Milan, which holds and preserves the original masterpiece. For researchers and scholars, the detailed visual cataloging of this collection offers a unique approach to intersecting cultural heritage with digital tools to open new ways to study and experience this collection of texts and drawings – uncovering Leonardo da Vinci’s thought evolution through data-visualization.

Celebrate the 500th anniversary of Leonardo Da Vinci’s death by opening up one of his most famous collections of drawings and writings for the world to see — through a digital interactive visualization.

Since its launch, the site has collected more than 150,000 unique visits and has received 7 international, prestigious awards like the Webby Award and the Information is Beautiful Award and many others.

This cataloging of the Codex Atlanticus is unique and will open new ways to study this collection of texts and drawings combined with a sophisticated design and data-visualization approach.
Since its launch, the site has collected more than 150,000 unique visits and has received international prestigious awards like the Webby Award, the Information is Beautiful Award and many others.

Year:

2019

Industry:

Education & Culture

A visual artefact shows the dashboard's main visualisation and data coming to life, emerging from the screen

The Process

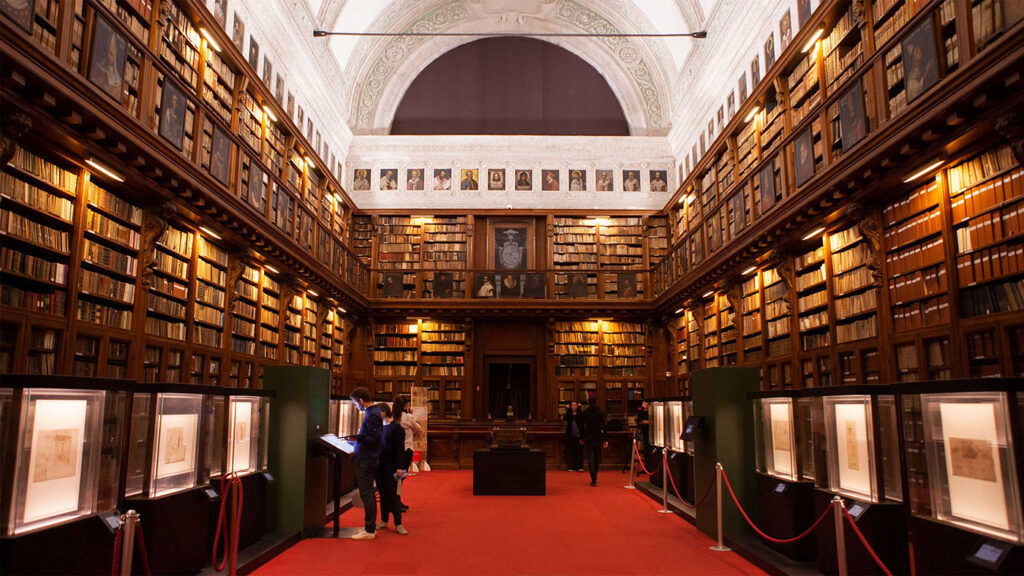
This project started with the collaboration of the public library and keeper of the Codex Atlanticus, the Veneranda Biblioteca Ambrosiana in Milan.

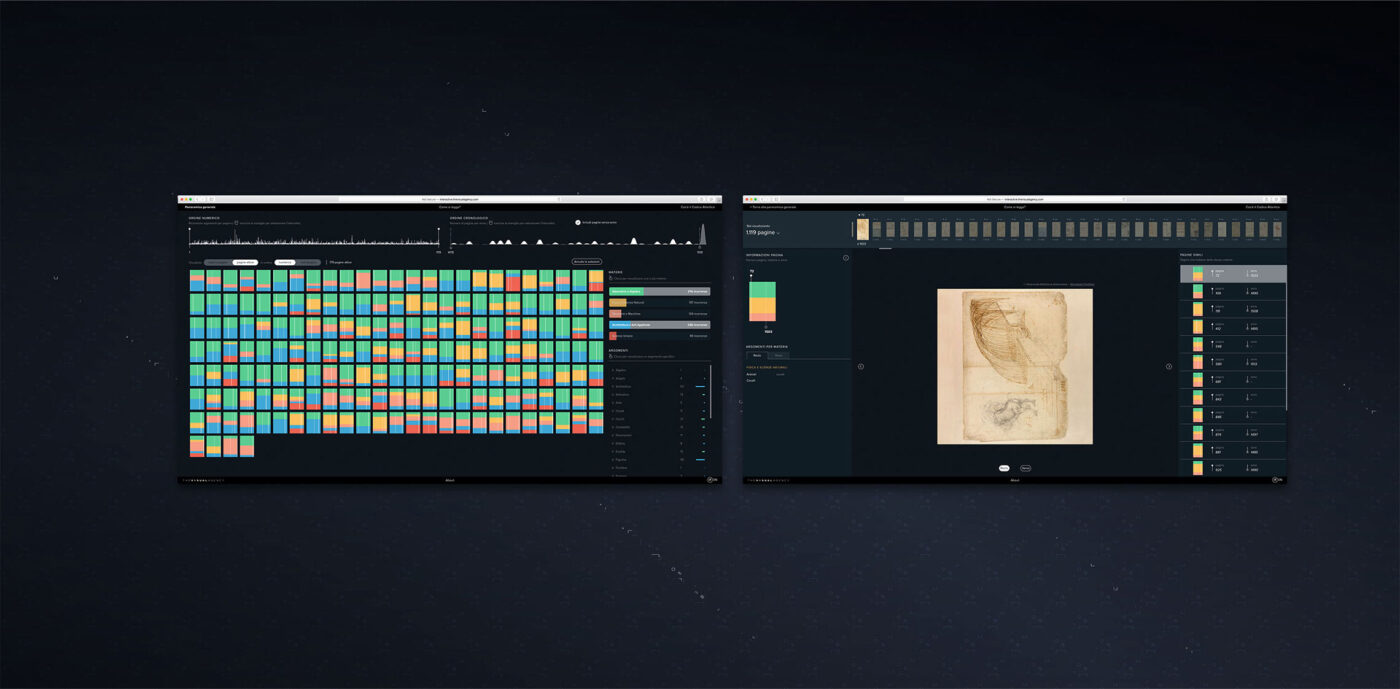
Provided with exclusive access to the collection, The Visual Agency carefully curated all the elements of this project, from the creation of the database through to the design and development of the application itself.

A collage features two project layouts: a dashboard overview of book subjects and timeline, and a specific focus on each page

The page module

The indicators for the page number (rhombus and continuous line) and the year of writing (circle and dashed line) are positioned horizontally along the width of the page to offer a linear timeline of works and pages.

The bars that represent each subject are proportional in size to the frequency with which topics occur on each page.

A thousand pages in 40 years

Philological studies have identified the year of writing of every page. The graph shows the number of pages produced each year, from 1478 to 1519.

See how the touchscreen works:

Our Projects

COVER 1500
TVA Website_D700_COVER 1500 x 1500 px
TER2_TernaCO2_Cover 1500
TER3_COVER 1400
COVER 1500 px
A digital flowchart displays interconnected process steps in Italian, categorized by "Macro fasi," "Fasi," "Sottofasi," and "Attività."

We’d love to hear about your project! Drop us a line