Consultancy phase 1 - Analyzing the status quo
The process
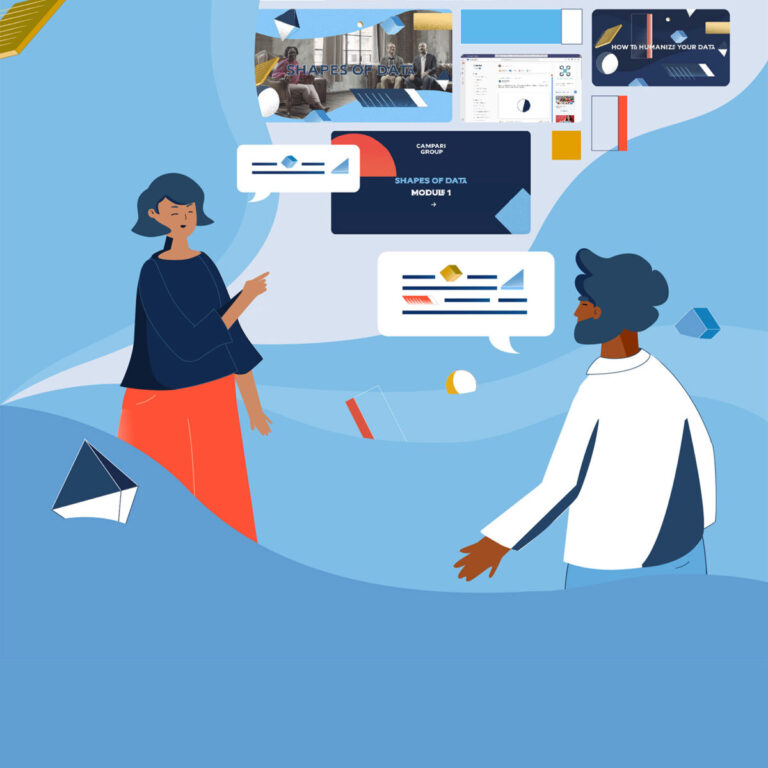
To unify fragmented communication styles, we reimagined the end-to-end design and development process for interactive visualizations. In 2020, we conducted a comprehensive accessibility audit, updating the design system for visual coherence and WCAG compliance. This overhaul streamlined content creation while ensuring digital inclusivity across all data-visualizations.
Consultancy phase 2 - Developing an organic Information design system
Designing guidelines
The drafting of simple style guidelines for the design of infographics would not have been sufficient to support the design and development needed for broad-production.
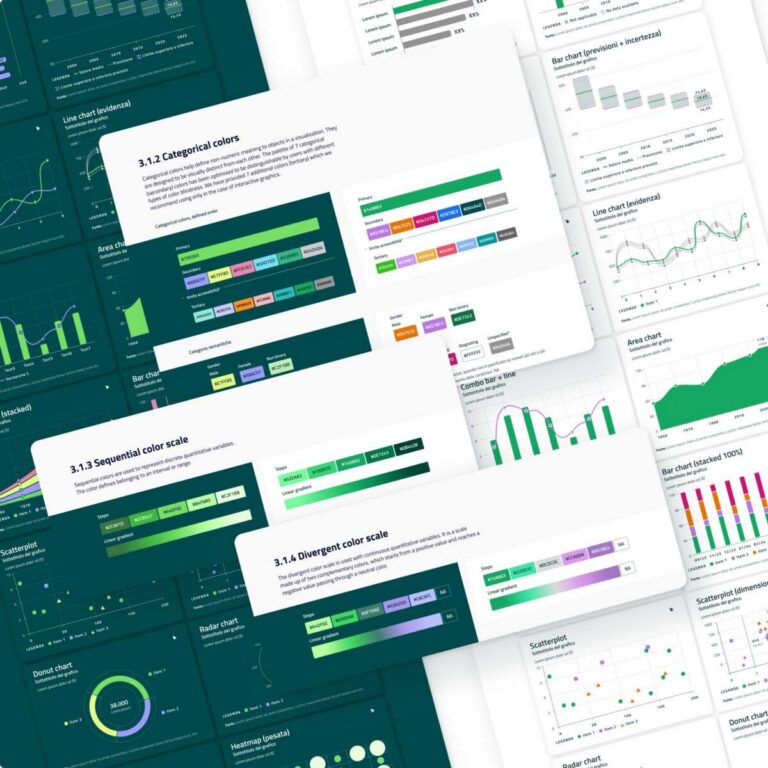
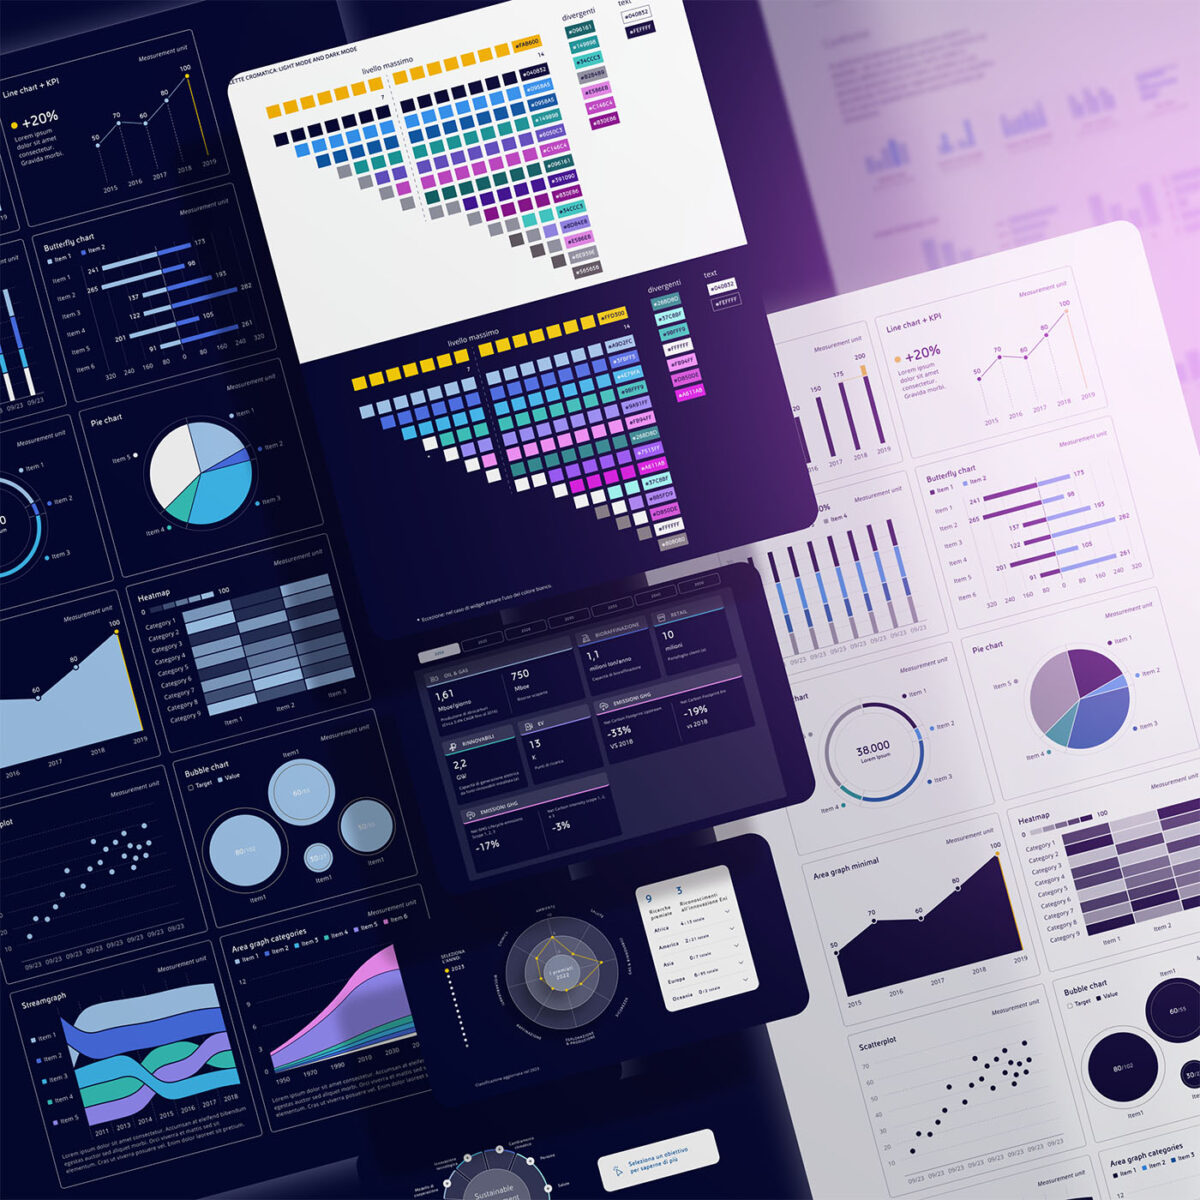
An entirely new style system was developed, creating and incorporating the brand guidelines provided by the client and combining these with an analysis of previous projects, focusing on the future content needs and outputs of the company.
In 2020 the design system has undergone a review applying WCAG AA accessibility standards.
Combining elements & navigation
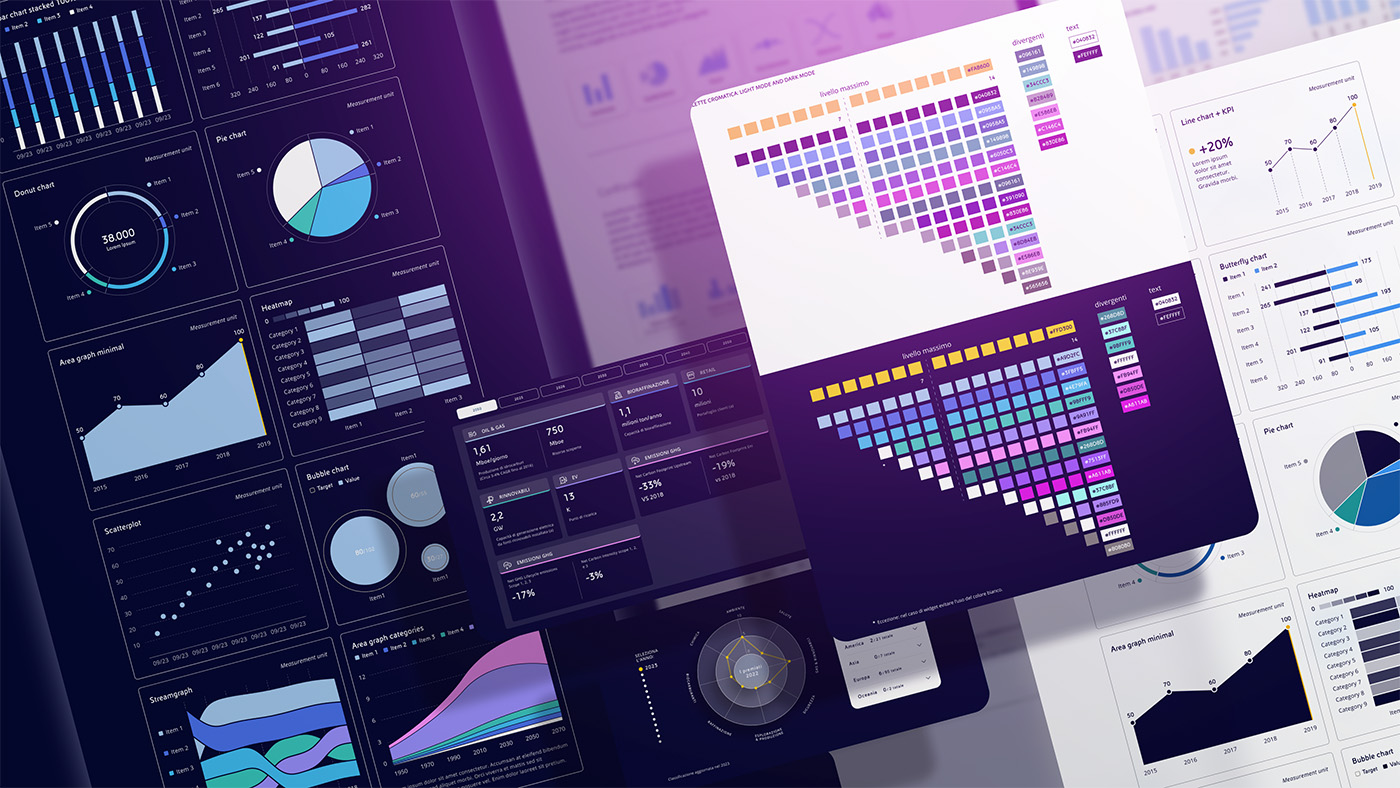
The combination and interaction of the different atomic elements have allowed us to create a new and appealing modular system, keeping the client’s design identity.
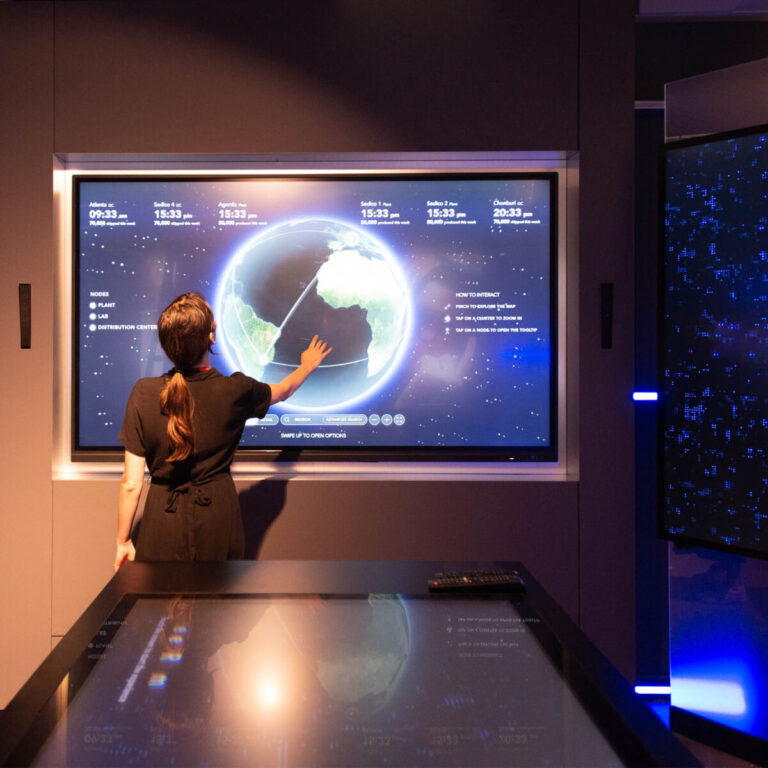
A linear and intuitive navigation mode has been designed to facilitate the use of content.
Consultancy phase 3 - To apply the information design system
The application
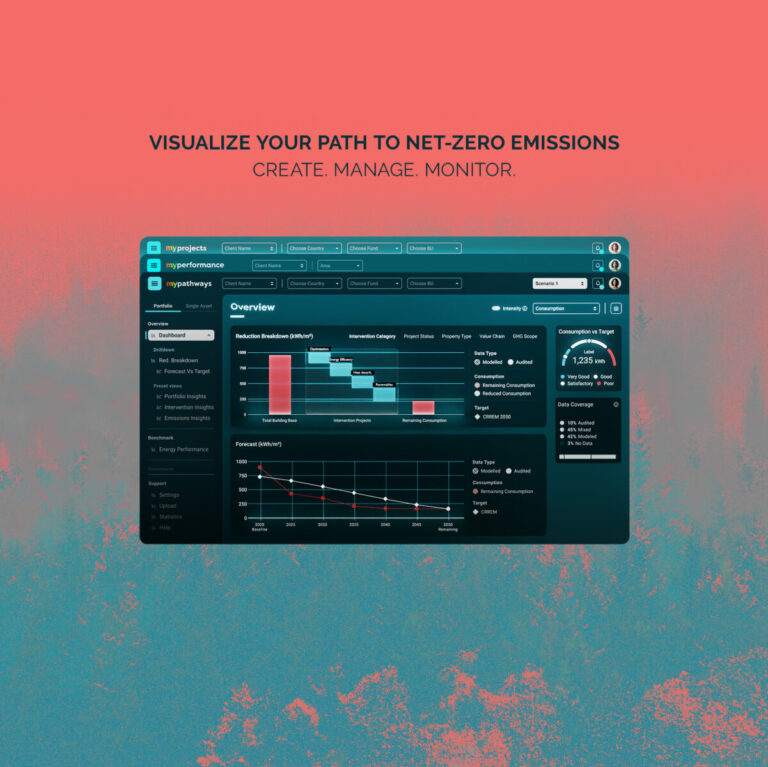
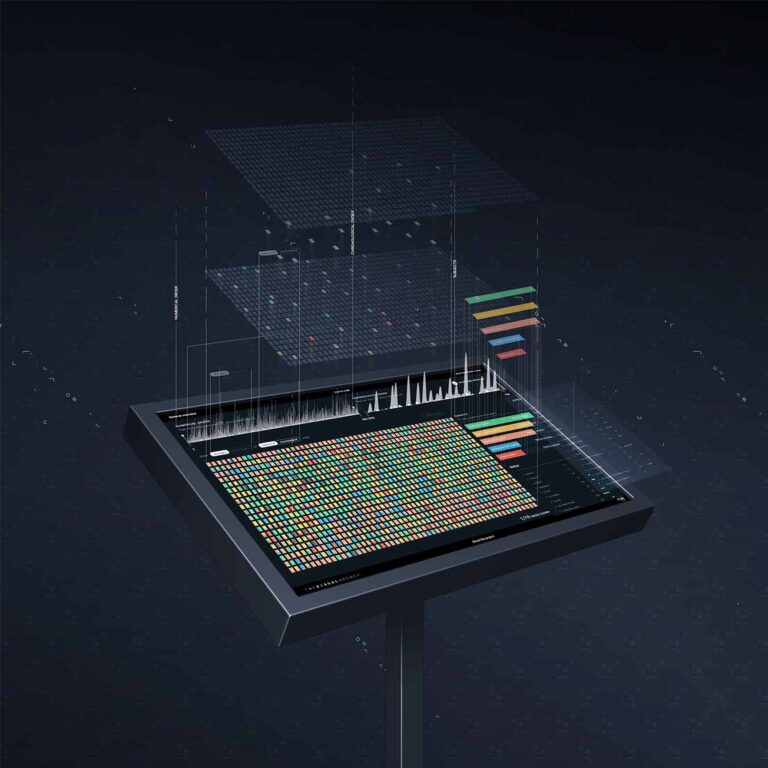
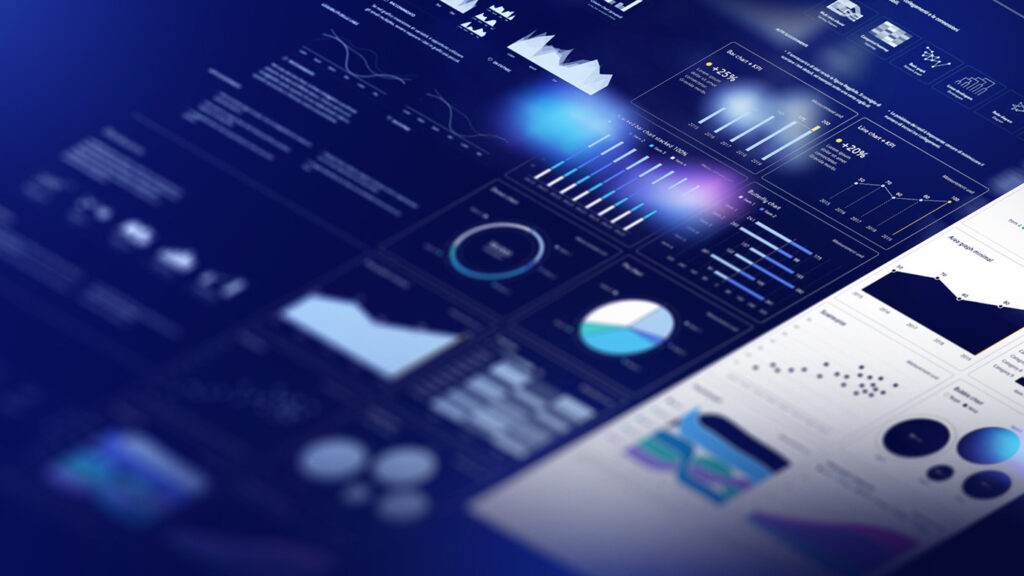
The system was then used as a starting point for the design of new infographic components. Different textual, dynamic and interactive elements are used to create complete and immersive visualizations that clearly represent data and make content easily accessible.
The design system includes detailed guidelines on how they can be applied to the creation of easy and complex graphs and interactive widgets and how these data-visualization elements are integrated into existing long-forms and microsites in a coherent and correct manner.