Designing credible storytelling for oncology data
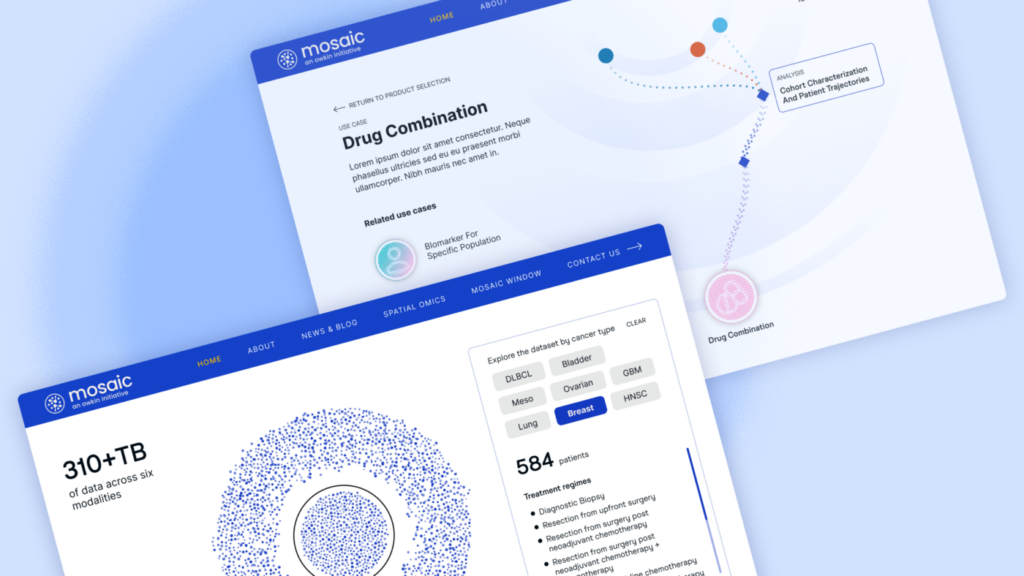
The Set-up The visual system is based on an elemental unit: a graphic particle representing the patient and structuring the entire framework. The six data modalities activate and reorganize this dynamic constellation: selecting a modality or filtering by tumor type reshapes cases, revealing the relational nature of the data. The same language guides the product-focused […]
An accessible guide to the Italian Constitution
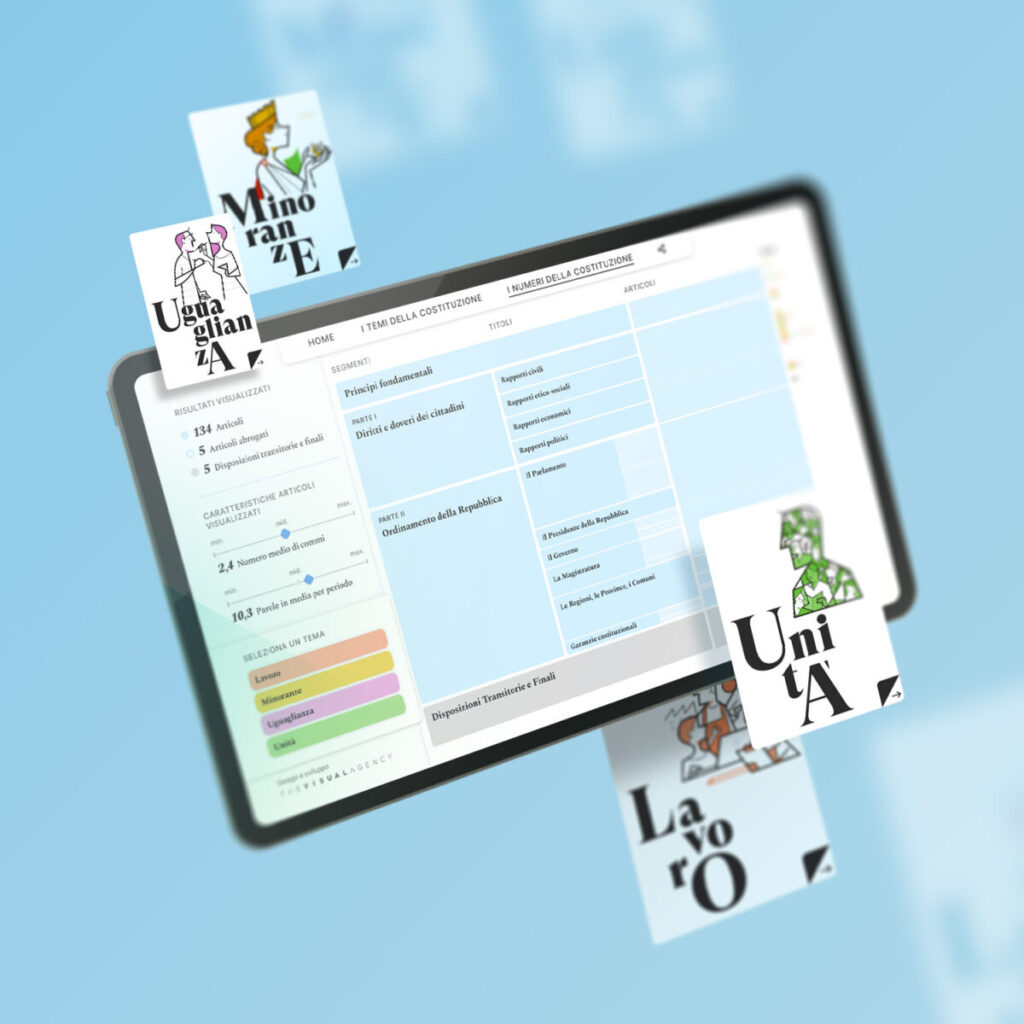
Accessible organization of resources Through the use of data visualization, we were able to enhance the information of an historical and complex document like the Constitution. Our team collaborated with WITHUB in the initial phase of the project to define the flow of information and conduct content research. Subsequently, we highlighted the most relevant themes […]
A digital collection of Raphael’s masterful works
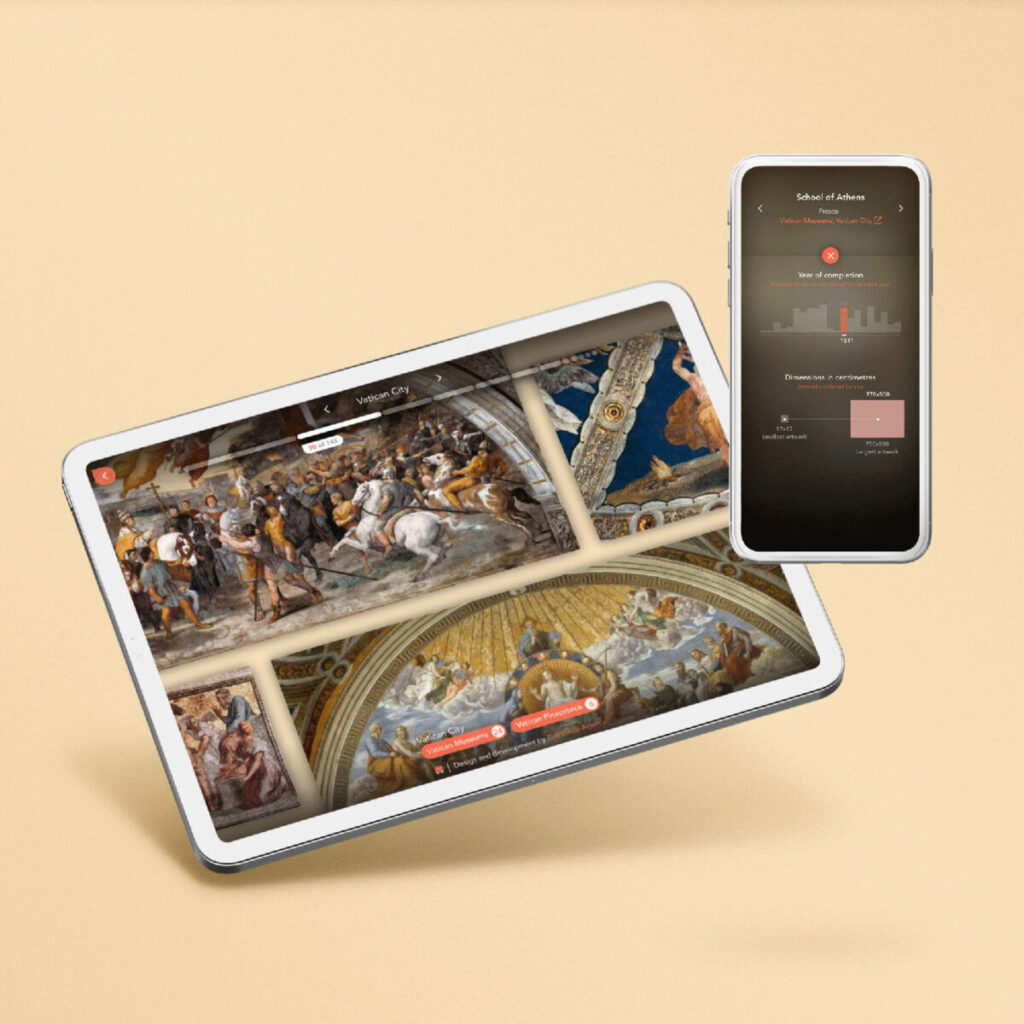
https://thevisualagency.com/wp-content/uploads/2025/06/MUS1_Screenrecording.mp4 All of Raphael’s paintings The main overview gathers all of Raphael’s paintings organized by sites and museums and the geographical location of their display. The interface design The design is optimized for multi-screens, adapting automatically to the user’s device . Each virtual exhibition art piece is displayed through a high-resolution image of the work. https://thevisualagency.com/wp-content/uploads/2025/06/MUS1_Screenrecording_2.mp4 […]
Sunday read: story-telling through complex data visualization
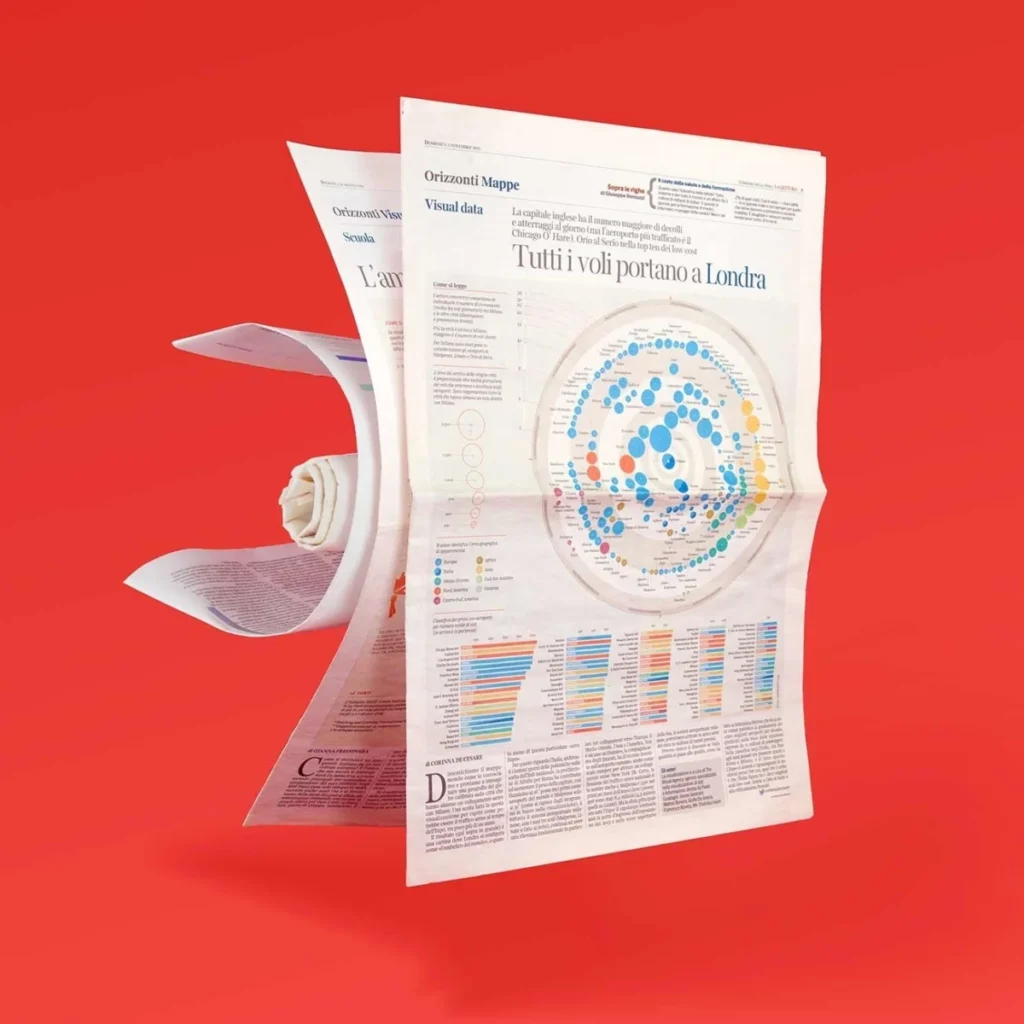
Visual Data Visual data was launched in February 2018. The Visual Agency’s collaboration with Corriere della Sera however, dates back to 2013. Since the beginning of this partnership, we have created a large number of static and interactive visualizations both for the print and online newspapers. The process Our work for Corriere della Sera includes […]
What’s next for Milan’s Expo area?

The interactive dashboard Users can explore and analyze each of these answers to determine the public’s preference for the future of the EXPO Milan area. We designed an interactive application which allows the user to explore and analyze every single open-ended response through organization of answers into topical clusters according to socio-demographic criteria. The visualization module Every circle represents […]
An immersive experience behind renewable energies
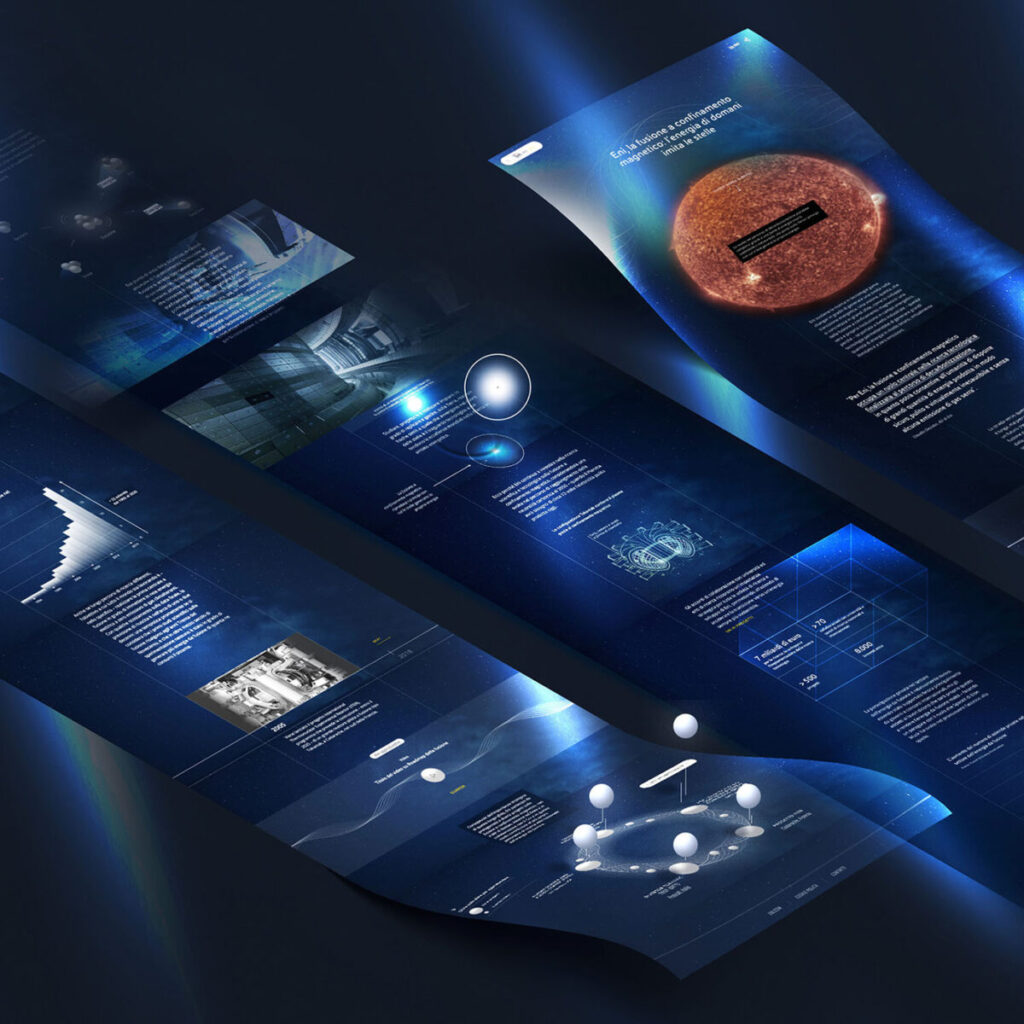
https://thevisualagency.com/wp-content/uploads/2025/06/TVA-Website_Eni-Fusione_asset-1.mp4 The Set-up The Visual Agency designed a page that immerses the viewer in the concept of magnetic confinement fusion as a replication of stellar energy. This is achieved through a background that portrays a starry sky and reacts to the movements of the mouse cursor, resulting in an engaging experience. The storytelling elements are […]
A digital collection to experience Dante’s Divine Comedy

A digital humanities tool The application is a tool that allows users to interactively analyze the structure and plot of the poem through the artworks that have been collected. About the Divine Comedy Dante Alighieri wrote the Divine Comedy between 1304 and 1321, the year of his death. The poem is written in the Florentine vernacular […]
Decoding Leonardo Da Vinci for the world

The Process This project started with the collaboration of the public library and keeper of the Codex Atlanticus, the Veneranda Biblioteca Ambrosiana in Milan. Provided with exclusive access to the collection, The Visual Agency carefully curated all the elements of this project, from the creation of the database through to the design and development of the application itself. […]
Data painting for energy transition
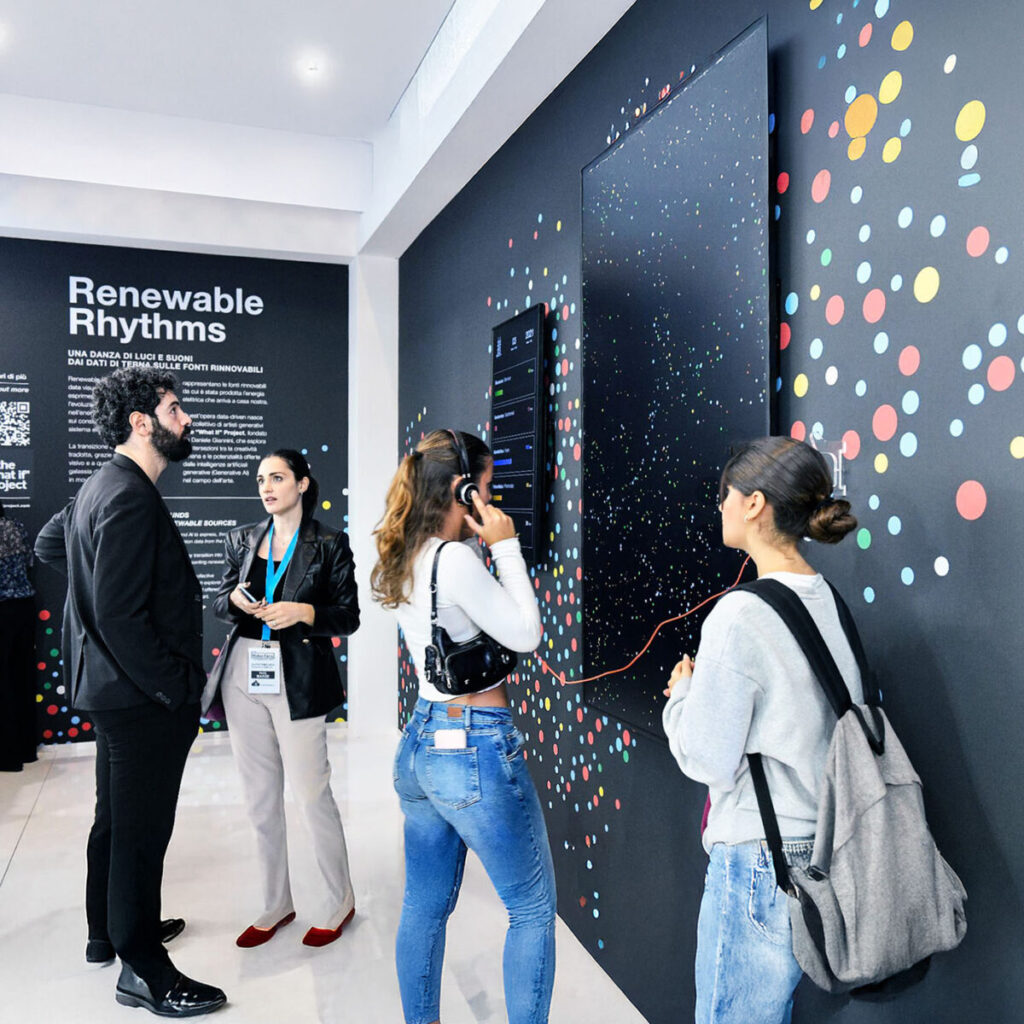
https://thevisualagency.com/wp-content/uploads/2025/06/TVA_Website_TER4_Asset_2_compressed.mp4 Accessible and engaging storytelling The longform designed by The Visual Agency, with text written and curated by Dalk, combines theoretical insights with technical explanations to explore Renewable Rhythms. On one hand, the theoretical section reflects on the ethical and creative use of datasets, drawing connections to other artistic projects. On the other, it delves […]
Data storytelling


