Client:

Owkin

Solution:

Data-storytelling

Designing credible storytelling for oncology data

Description

Background

MOSAIC is a scientific initiative led by OWKIN and research partners to integrate multimodal and spatial oncology data at scale. Communicating this infrastructure meant making a complex system visible: heterogeneous datasets, non-linear relationships, and analytical processes powering AI models. The project was conceived to make this knowledge infrastructure transparent without oversimplifying its scientific depth.

Design two interactive visualizations to make complex medical datasets readable and clarify their role in advancing AI solutions in oncology.

Two interactive visualizations define the narrative: one renders the patient dataset tangible, the other reveals how those data drive AI models and advanced oncology solutions.

The project unfolds through two complementary visualizations that frame MOSAIC as both data infrastructure and knowledge engine. One makes the scale and relational nature of patient data perceptible; the other reveals how multimodal datasets combine to generate AI use cases, turning scientific complexity into structured insight.

Year:

2026

Industry:

Associations

The Set-up

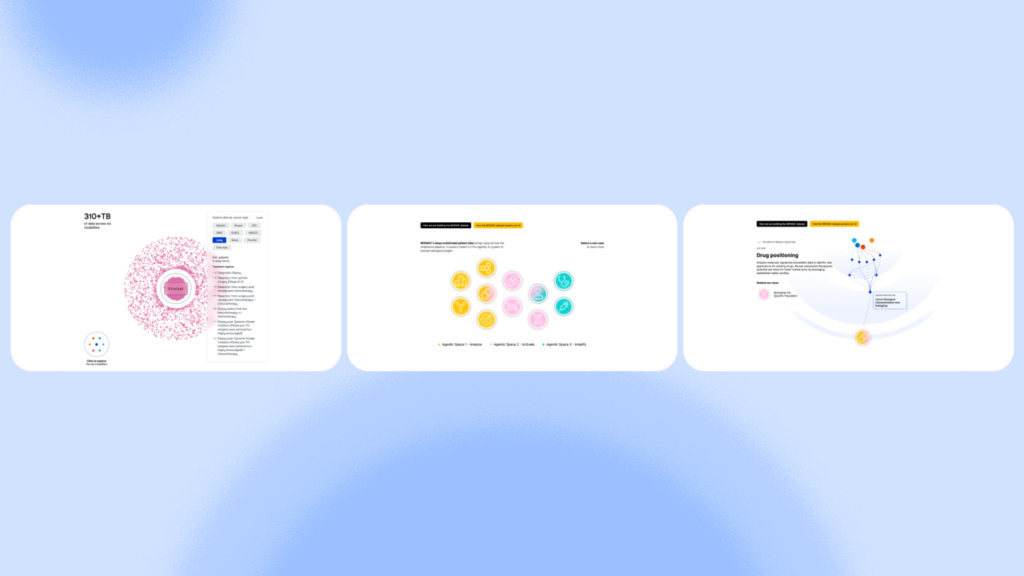
The visual system is based on an elemental unit: a graphic particle representing the patient and structuring the entire framework. The six data modalities activate and reorganize this dynamic constellation: selecting a modality or filtering by tumor type reshapes cases, revealing the relational nature of the data. The same language guides the product-focused view: an ordered, non-hierarchical network where different dataset combinations move through analytical layers to generate concrete AI use cases.

Production Process

The design process integrated solutions that amplified its impact. Animations were developed in Rive, enabling a level of micro-motion detail that would have been unattainable through code-only implementation. 

In the second visualization, the combinatorial network structure and the transformation of traditional icons into dot-based configurations were enabled by custom AI scripts, generating dynamic systems and reinforcing continuity between the visualizations.

The Backend Technology

The first visualization was developed using Matter.js, a JavaScript library for 2D physics simulation. Each patient, modeled as a point, behaves as a reactive entity, contributing to a dynamic and organic ecosystem.

The solution was delivered as a custom front-end component, embedded into the client’s Webflow site through dedicated integration, ensuring compatibility and full control over the digital experience.

Our Projects

People engaging with an interactive art installation titled "Renewable Rhythms" at an exhibition.
Campari Group's Sustainable mix 2024 project cover
COVER Campari Data Culture_quote
TVA Website_D700_COVER 1500 x 1500 px
MUS1_COVER 1500
Corriere della sera

We’d love to hear about your project! Drop us a line