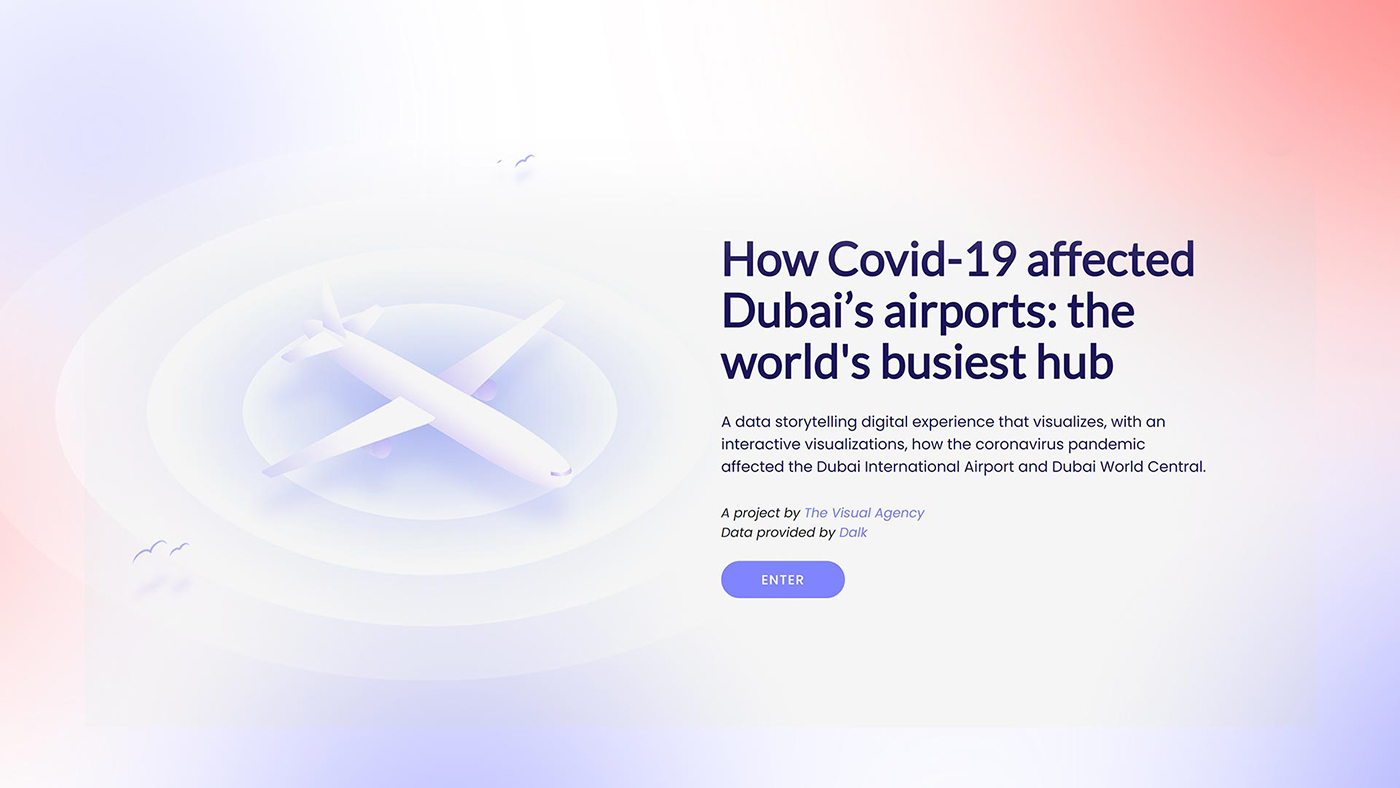
The pandemic has affected in a more or less evident way all human activities. At The Visual Agency we wanted to study in particular how much Covid-19 is affecting the international markets. To do so, we have created a data-driven project that tracks the traffic of the largest air HUB in the world: Dubai.
What is expected to be the biggest Expo of all time will open precisely in Dubai in a few days. For the event, we decided to create an application that shows the impact of the pandemic on Dubai’s connections in terms of flight reduction. Starting in January 2020, we’ve been collecting open data on all flights to and from Dubai, organizing it into a database that collects data from over 200,000 flights.
The interactive microsite allows you to navigate this ocean of data thanks to a visualization that shows air traffic trends on a weekly basis between Dubai and all the cities around the world the emirate is connected with.
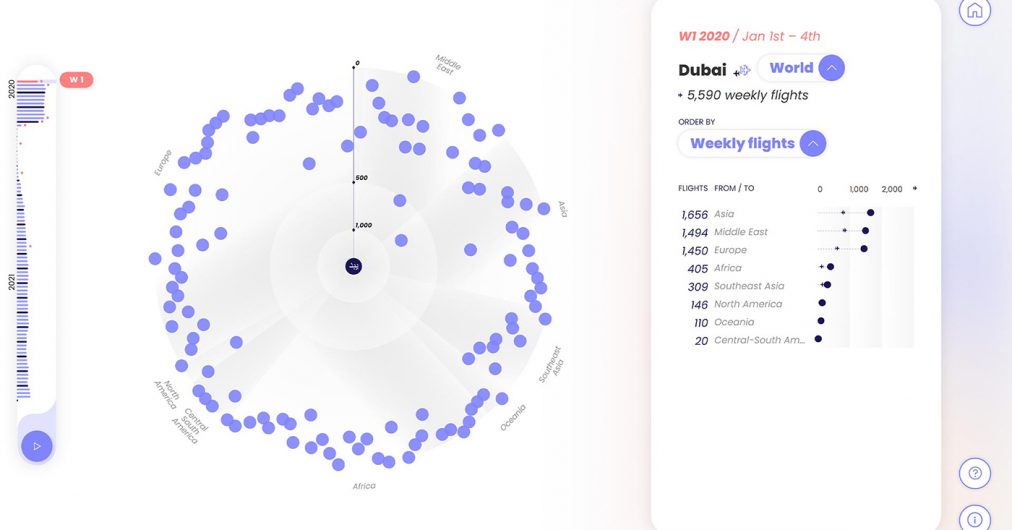
The visualization in the middle shows the frequency of flights based on the proximity of the outer dots (other countries) to the central one (Dubai). The player on the left makes it possible to study the variations in air traffic over time, while the section on the right makes it possible to compare areas and cities.
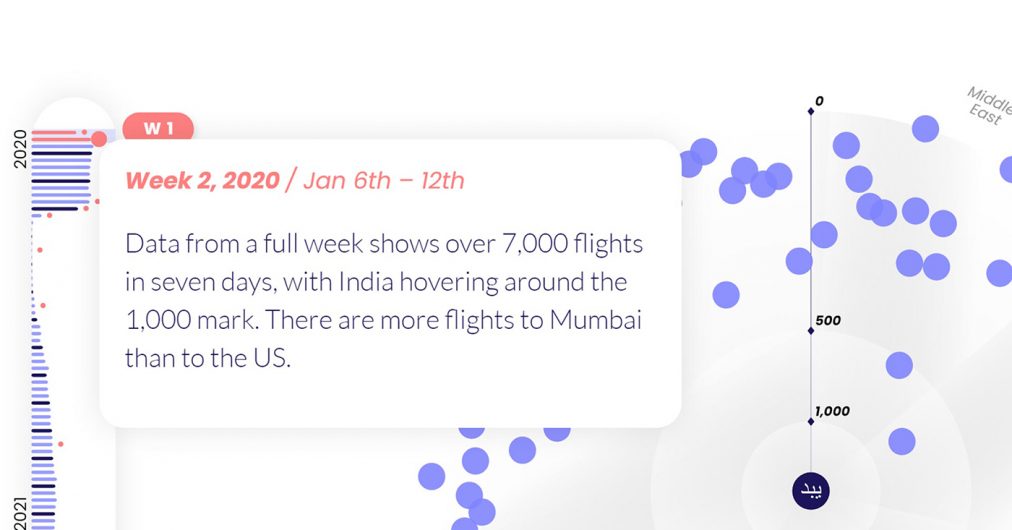
The application will be constantly updated throughout the event to measure the impact the World Expo will have on airport traffic and get real-time feedback.
