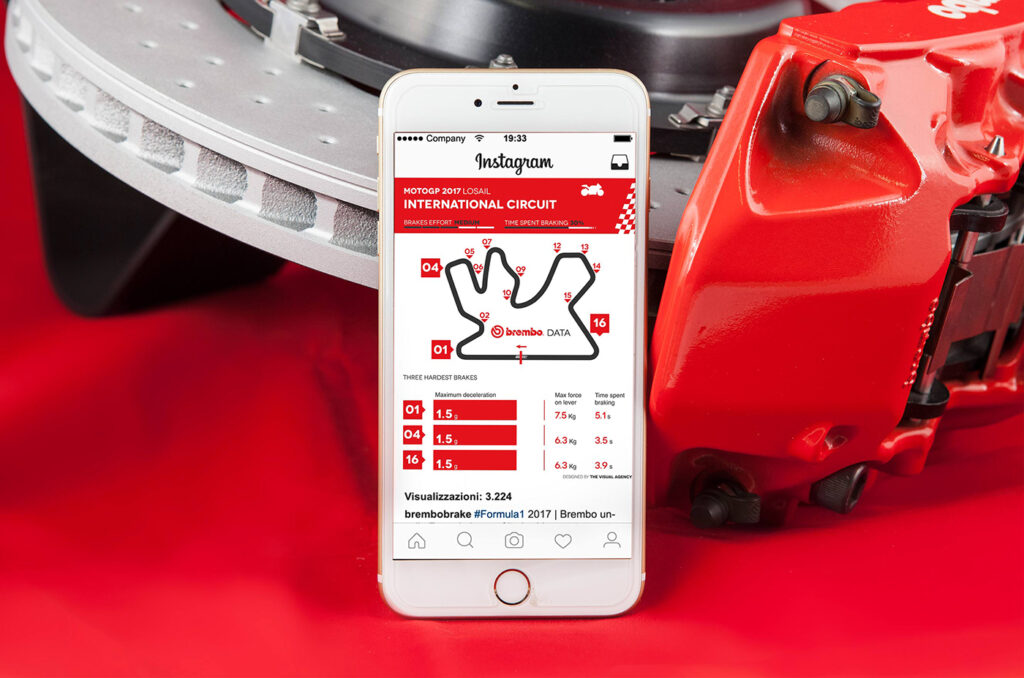
Infographic services
The Visual Agency produced three types of infographic content as part of this ongoing partnership:
- The descriptive table
- The summary tables
- The product feature board
The descriptive table
The descriptive table unpacks the overall stress on both the braking system and the driver on the most demanding curves of each race circuit and current Grand Prix race worldwide.
The summary tables
The summary tables classify the most difficult braking points throughout the championship.
The product feature board
The product feature board provides detailed information about discs, pads, brake calipers, and other performance stats related to the product itself.
These infographics are published on Brembo’s social channels, corporate website and on MotorSport blogs.


A publication to gather all the infographics
Brembo’s initial project – a collection of infographics linking car and team performance to braking system data – evolved to become a fully illustrated publication that reached 2000 print copies.
Although distribution of this prestigious work is limited to journalists, key clients and partners of Brembo, exposure through this publication and referral by Brembo’s network has proven to be a beneficial client acquisition tool.


