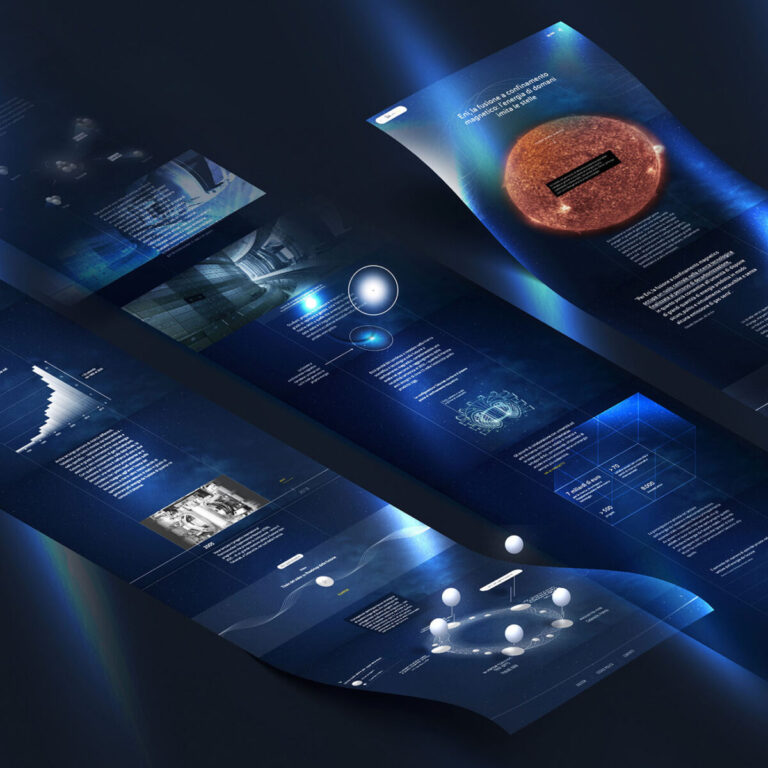
Accessible and engaging storytelling
The longform designed by The Visual Agency, with text written and curated by Dalk, combines theoretical insights with technical explanations to explore Renewable Rhythms. On one hand, the theoretical section reflects on the ethical and creative use of datasets, drawing connections to other artistic projects. On the other, it delves into the logic, formulas, and methodologies behind the technical development, simplifying complex algorithms and calculations through clear language, interactive visuals, and animations. Additionally, the use of data sonification transforms data into an engaging auditory experience, making complex topics like AI and renewable energy accessible to audiences with varying levels of expertise.
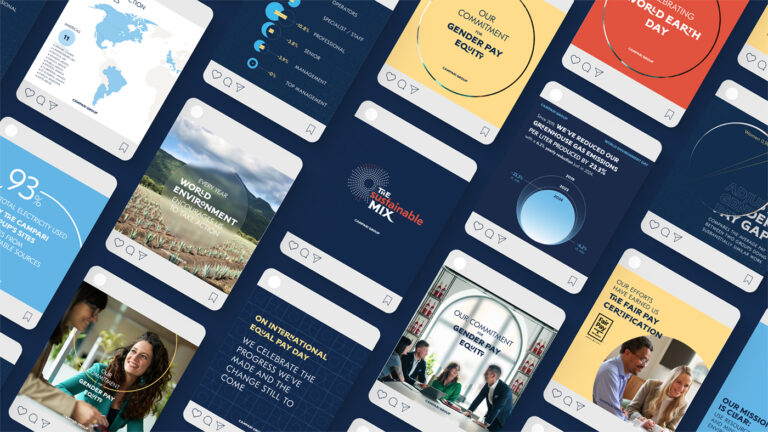
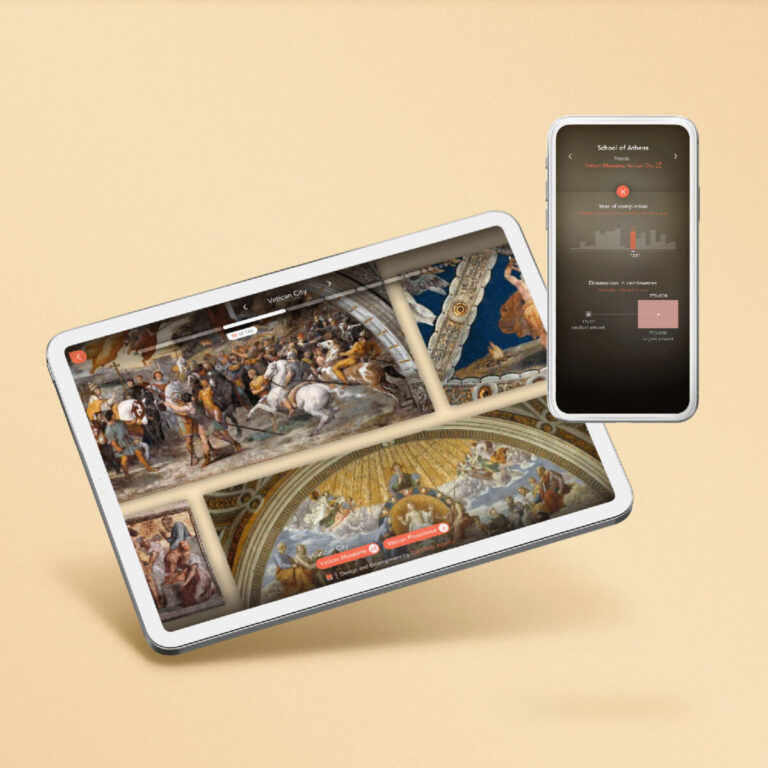
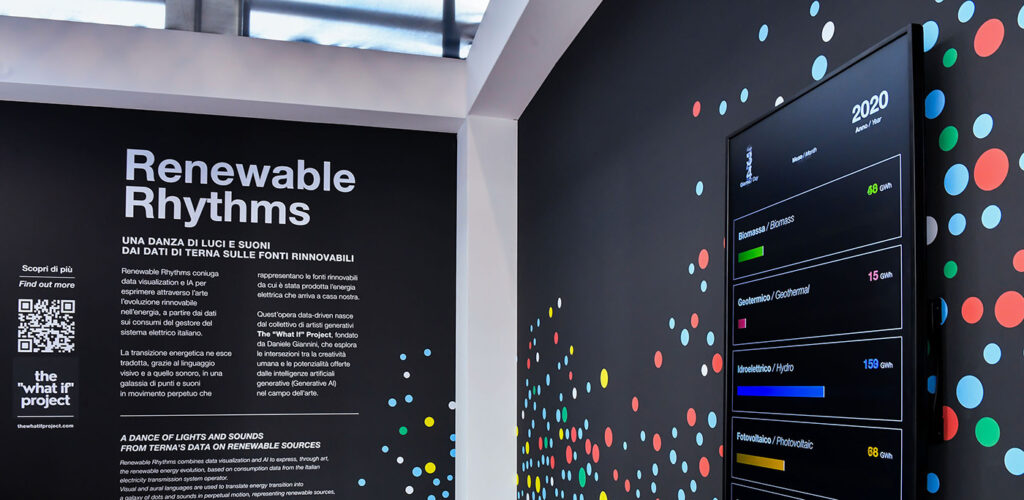
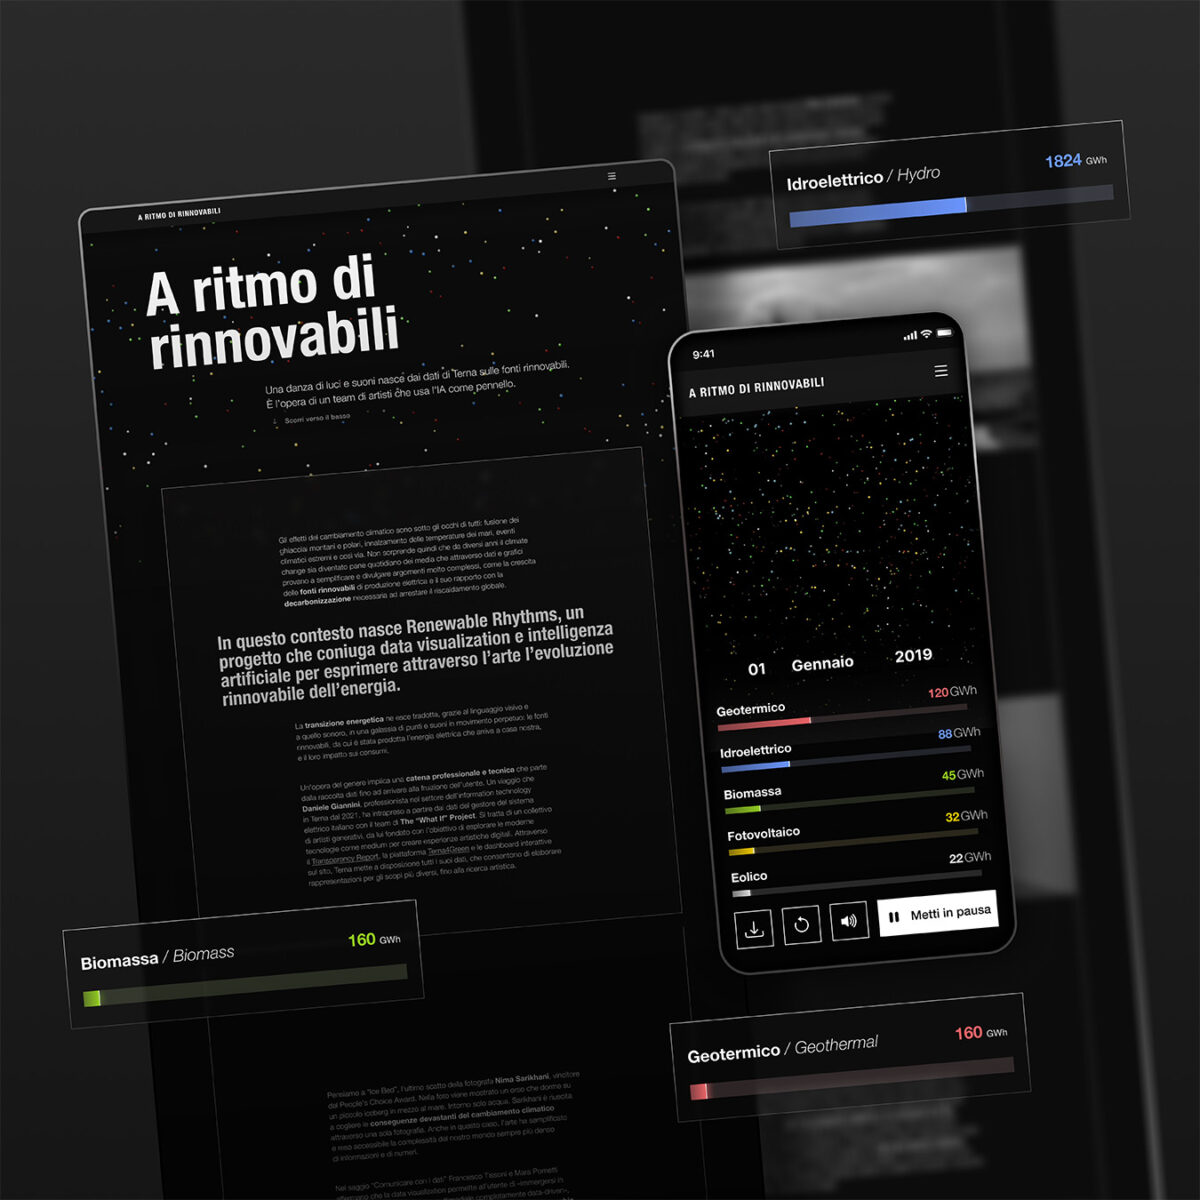
Modular dashboards design
The dashboards have been designed to function seamlessly across a wide range of platforms, encompassing both standard desktop configurations and large-scale monitors typically employed in exhibition settings. This inherent modularity ensures that the content can be adapted to suit diverse purposes, whether the objective is to facilitate an in-depth technical exploration or to deliver a high-level presentation suitable for public consumption during events.
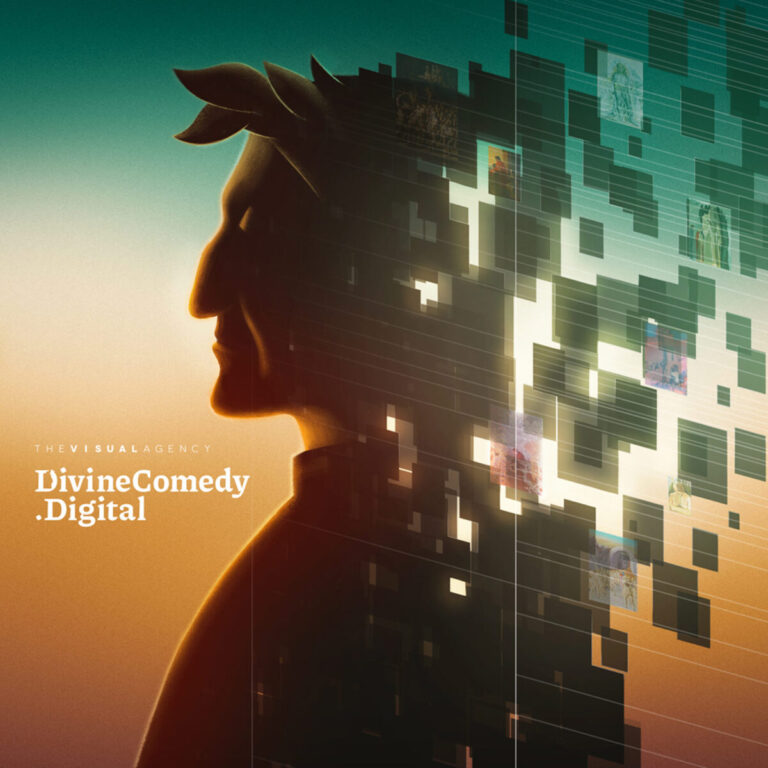
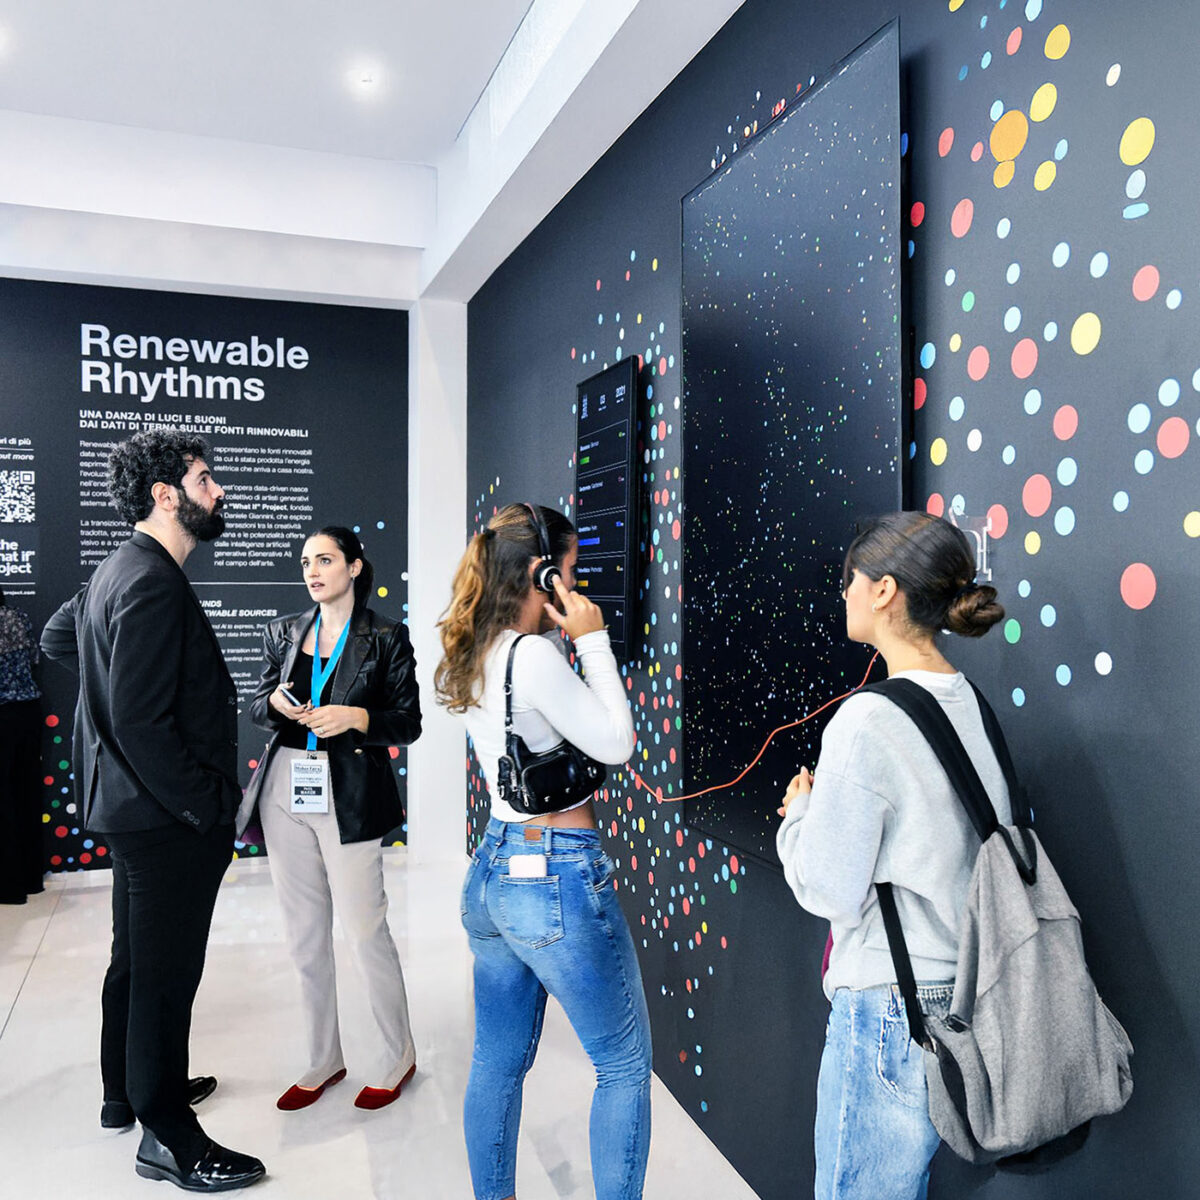
Integration of technical and artistic elements
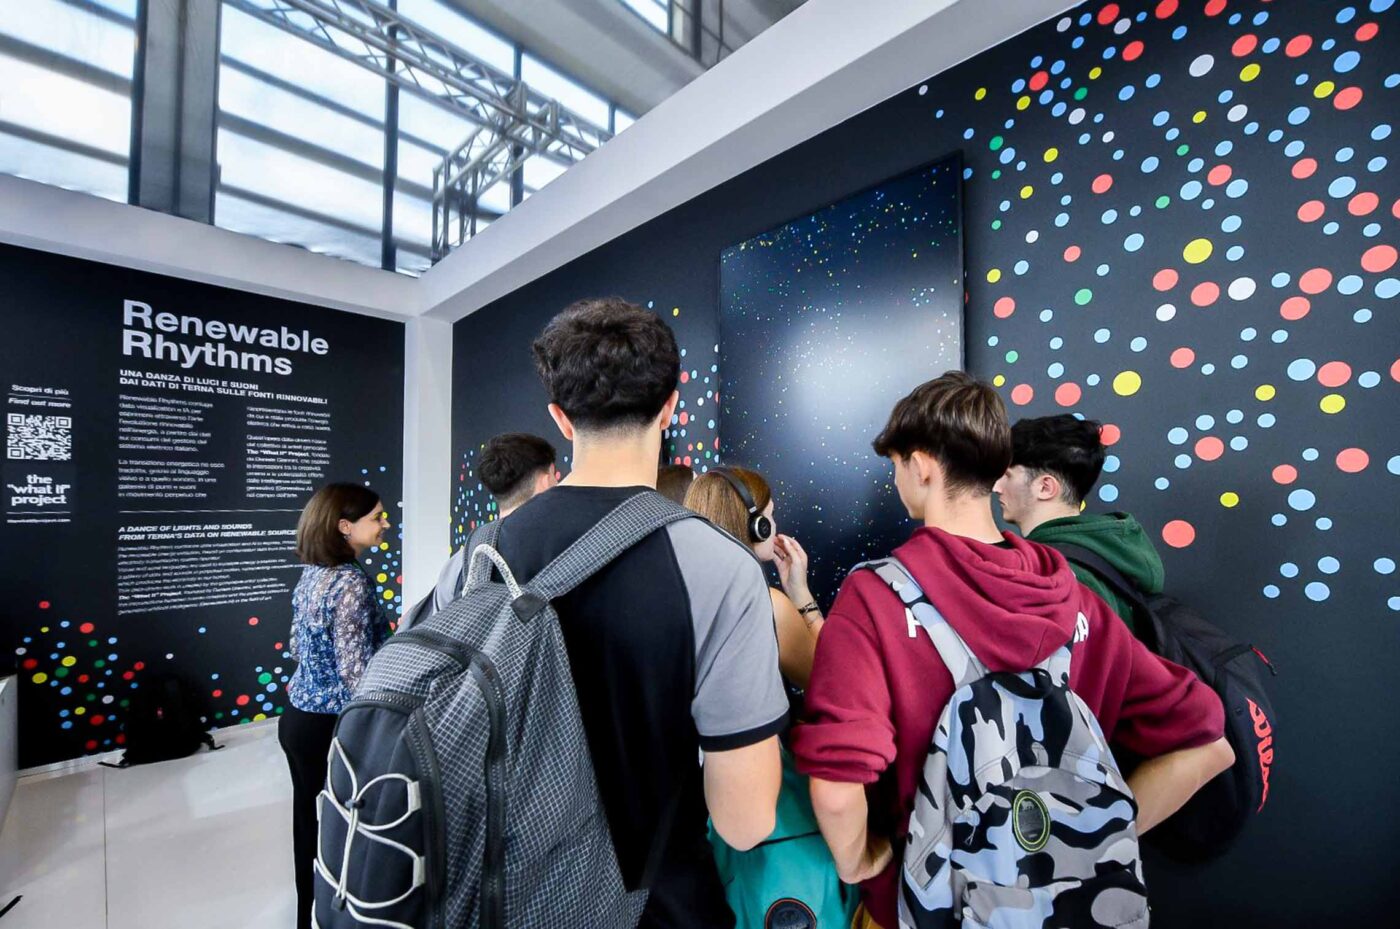
Renewable Rhythms blends data science and art, using data sonification to transform renewable energy metrics into sound. This approach not only showcases the technical precision of data analysis but also invites philosophical reflection on the ethical use of information, creating a richer experience for the audience. This multi-sensory journey sparks wonder and curiosity, encouraging the public to explore the intricate relationship between humanity, technology, and the environment.