A new generation of annual reporting
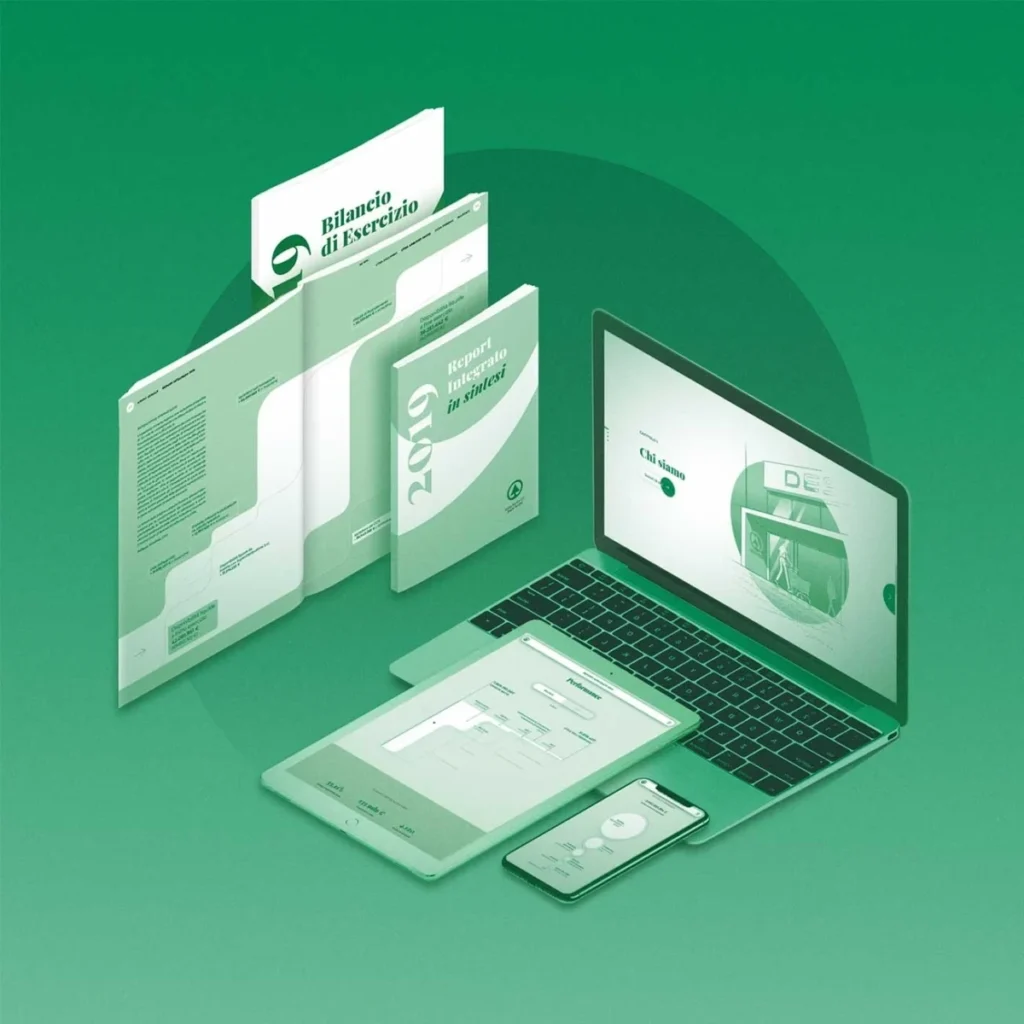
The hard-copy The hard-copy report consists of three books: the Financial report the Integrated report the Integrated short-report Data-visualization The reports contain state of the art data representations to support financial information and the economic funnel. The micro-website The digital version of the report is hosted by the client in a dedicated micro-website. Available for desktop, tablet and […]
A dashboard to profile media consumers
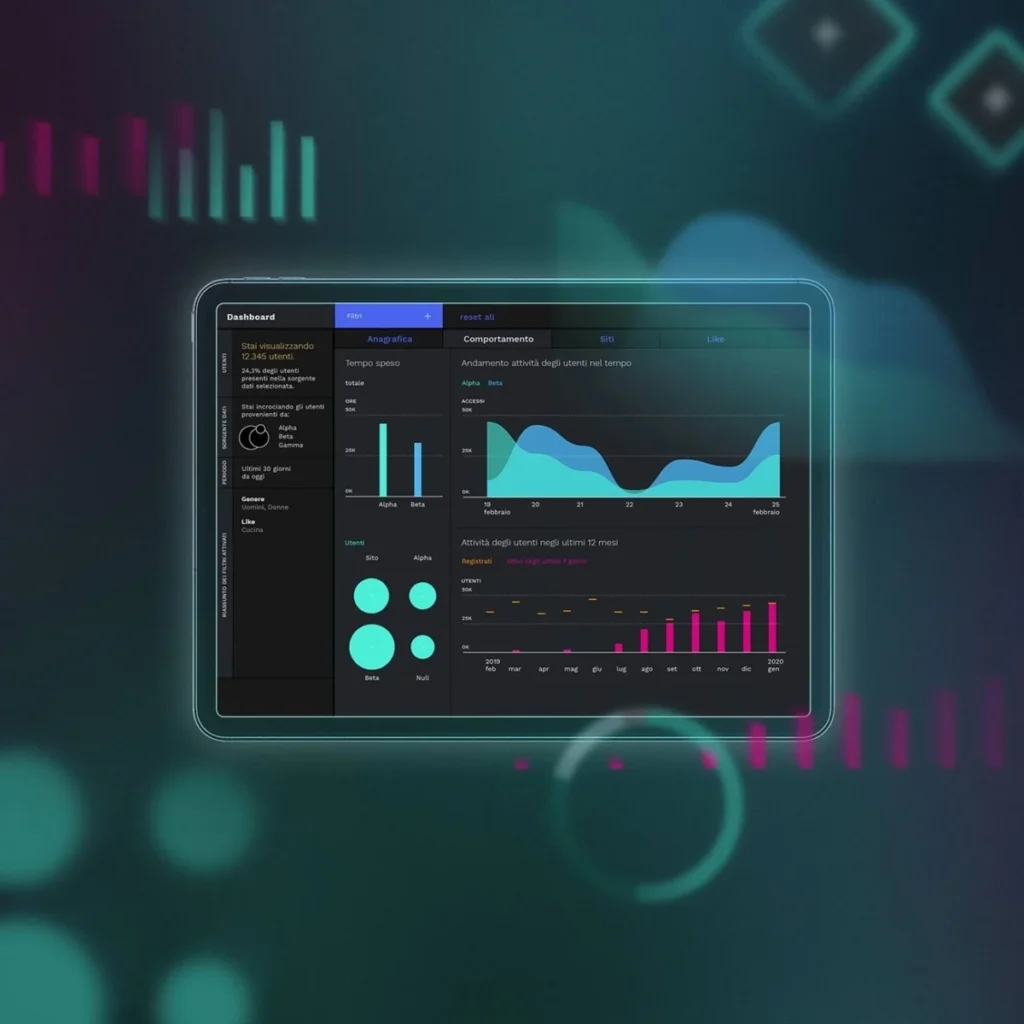
The dashboard design The different shades and scales of black exalt the spaces between the different graphs and the color selection. The use of outline borders for the graphs and the sans serif font are equally important for the user experience and user friendliness of the dashboard’s design. The accessibility The black background has been chosen to create […]
Eni For: a sustainable story
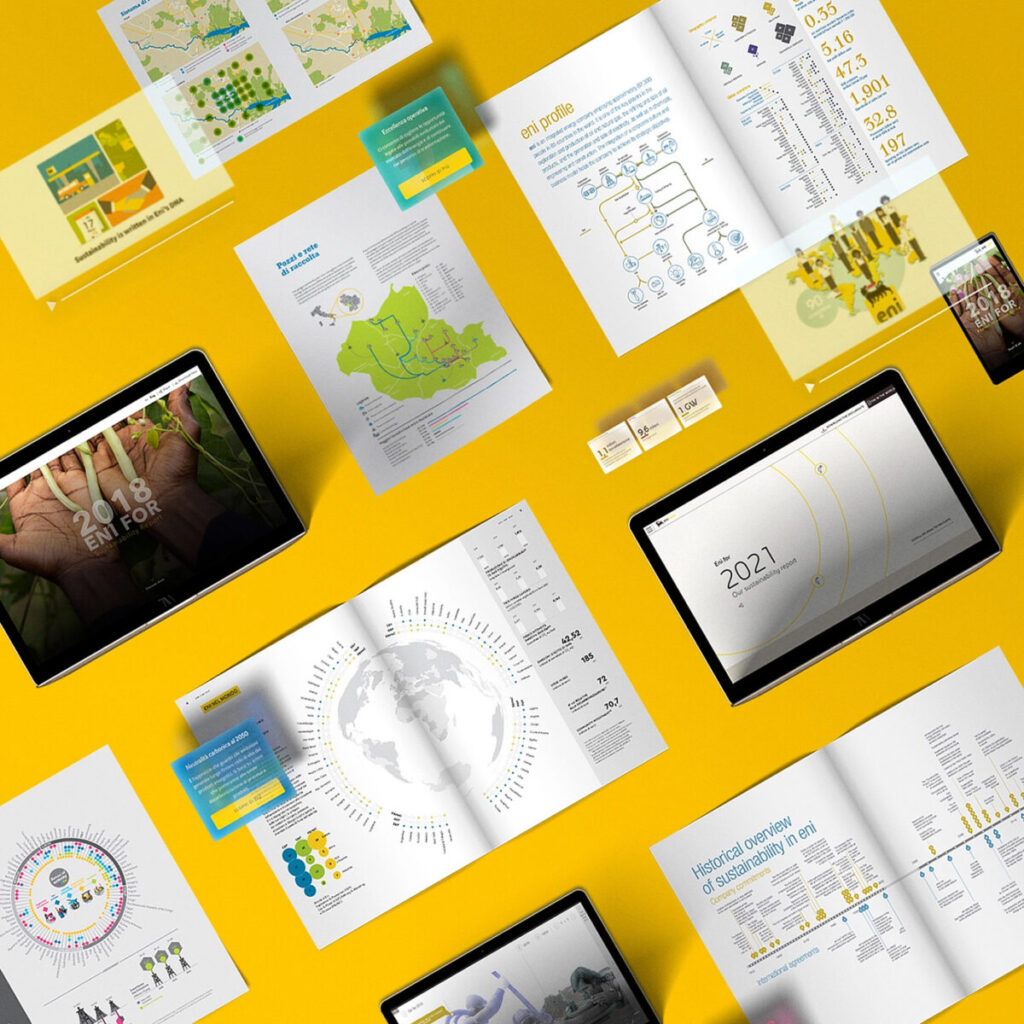
A long collaboration A long collaboration allowed us and the client to establish a coherent path of research and experimentation. Over these ten years we have produced and delivered Eni’s sustainability reports in three types of formats: printed; video; digital/interactive. From pioneers to point of reference If in 2012 we were pioneers developing an approach […]
A digital platform to guide energy transition
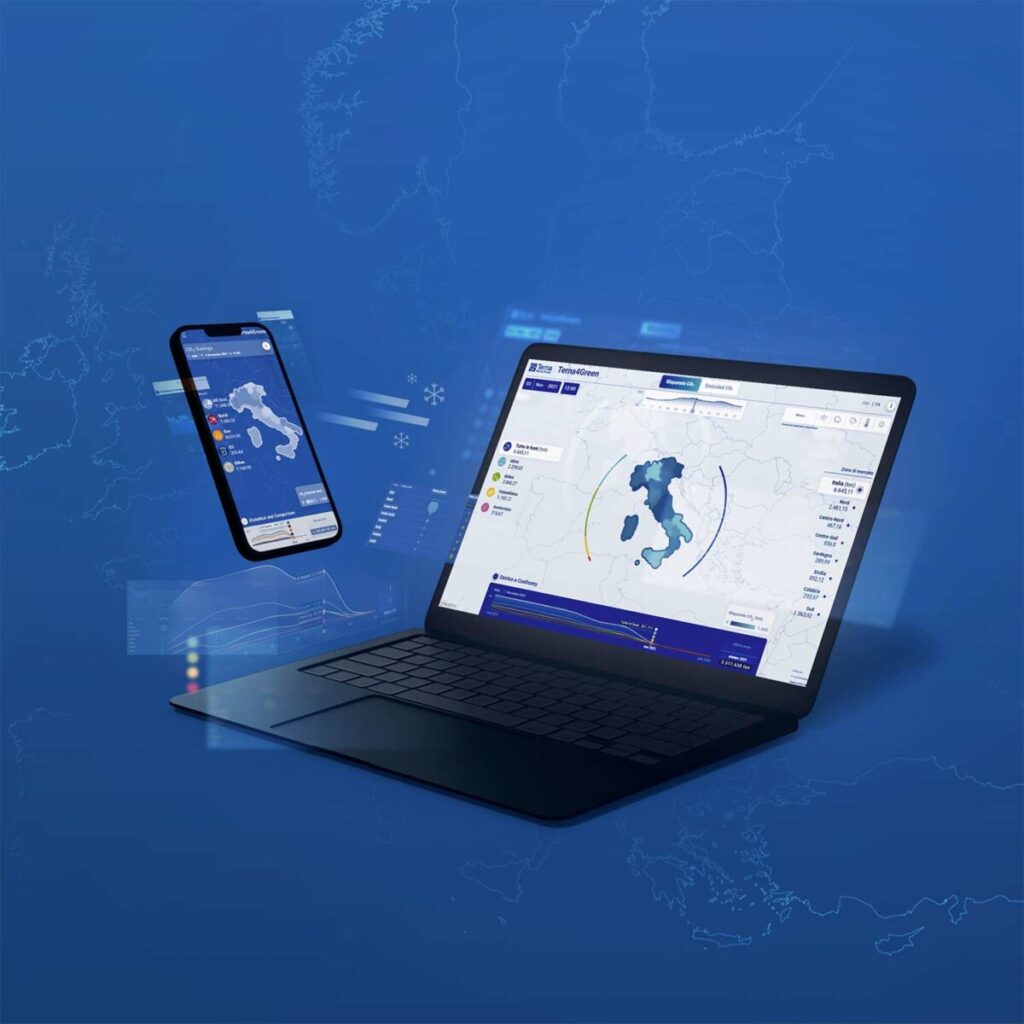
A public and mobile-friendly dashboard As the operator of the entire national electricity grid, Terna produces and collects massive amounts of data on a daily basis. In addition to exploiting the potential of this data to improve decision-making processes and implement new business strategies, the company felt the need to put it at the service […]
The sustainability report of the future: interactive, multimedia, for everyone
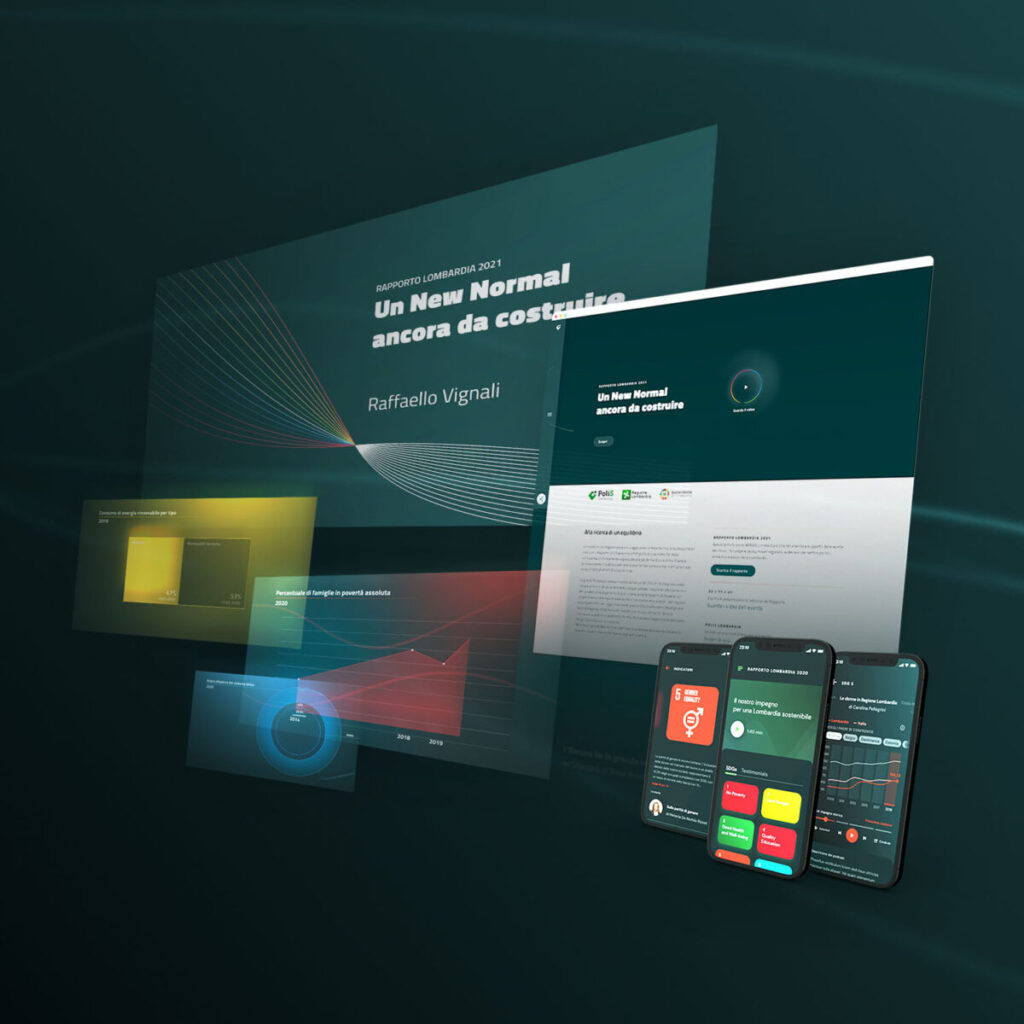
Data-driven storytelling within everyone’s reach Citizens, regional policy makers, decision makers in the political, economic and social sectors: each part of this project has been created with an heterogeneous audience in mind. The tailor-made solutions of this project are: A microsite: is the main support, used by all users to navigate the content. A motion […]
Communication ecosystem for corporate sustainability
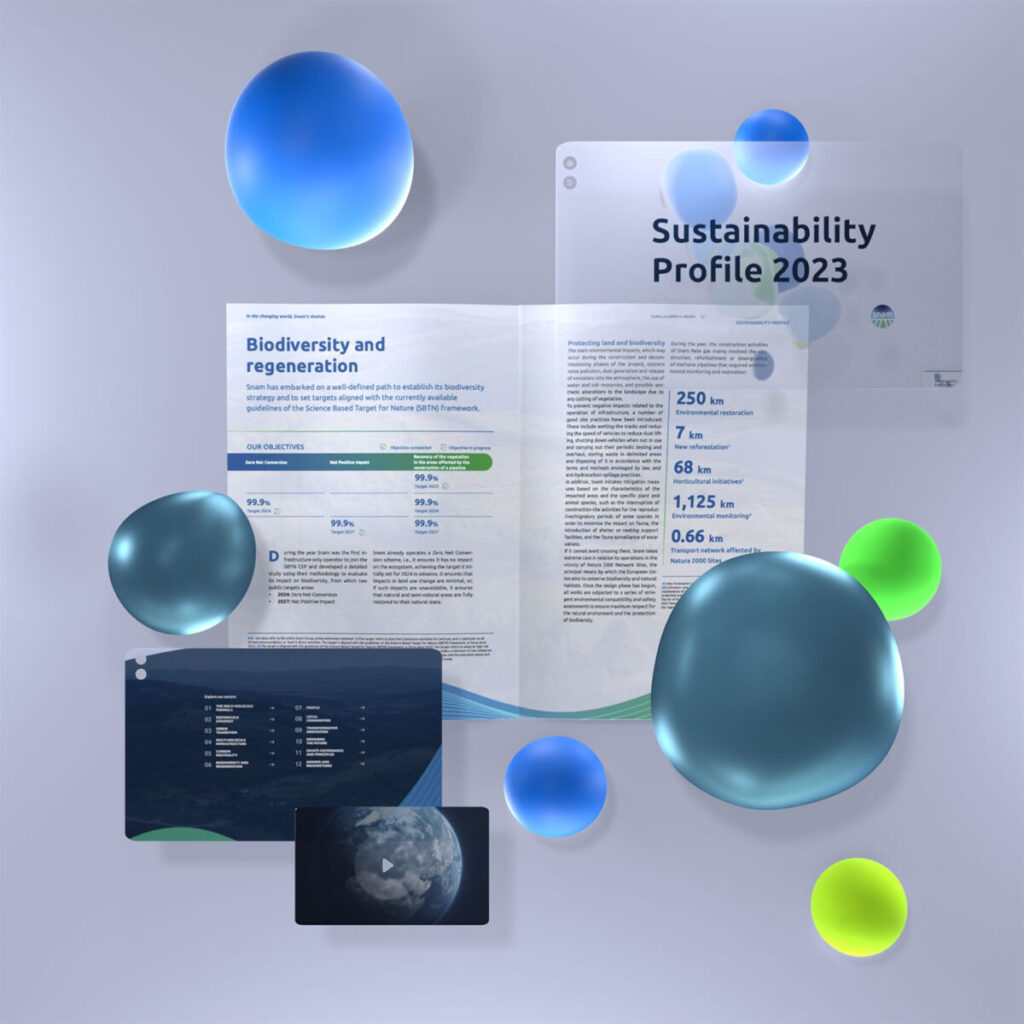
Three outputs for enhanced user engagement We began with the static report, characterized by a clear organization of information supported by KPIs, graphs, and engaging visualizations. We then introduced the digital report which enhanced its communicative power thanks to its immediate and easy exploration, making the consumption of information more effective and engaging. The third […]
Reporting and Monitoring

An interactive atlas for operational mapping

Immersive exploration on every screen The map offers an immersive exploration experience through an 86-inch screen and a comprehensive view of the data. With the touch-zoom feature, users can effortlessly zoom in and out using a simple two-finger gesture, granting swift access to every corner of the globe. Whether navigating through vast regions or focusing […]
Banca Etica: B-corp Report of Impact
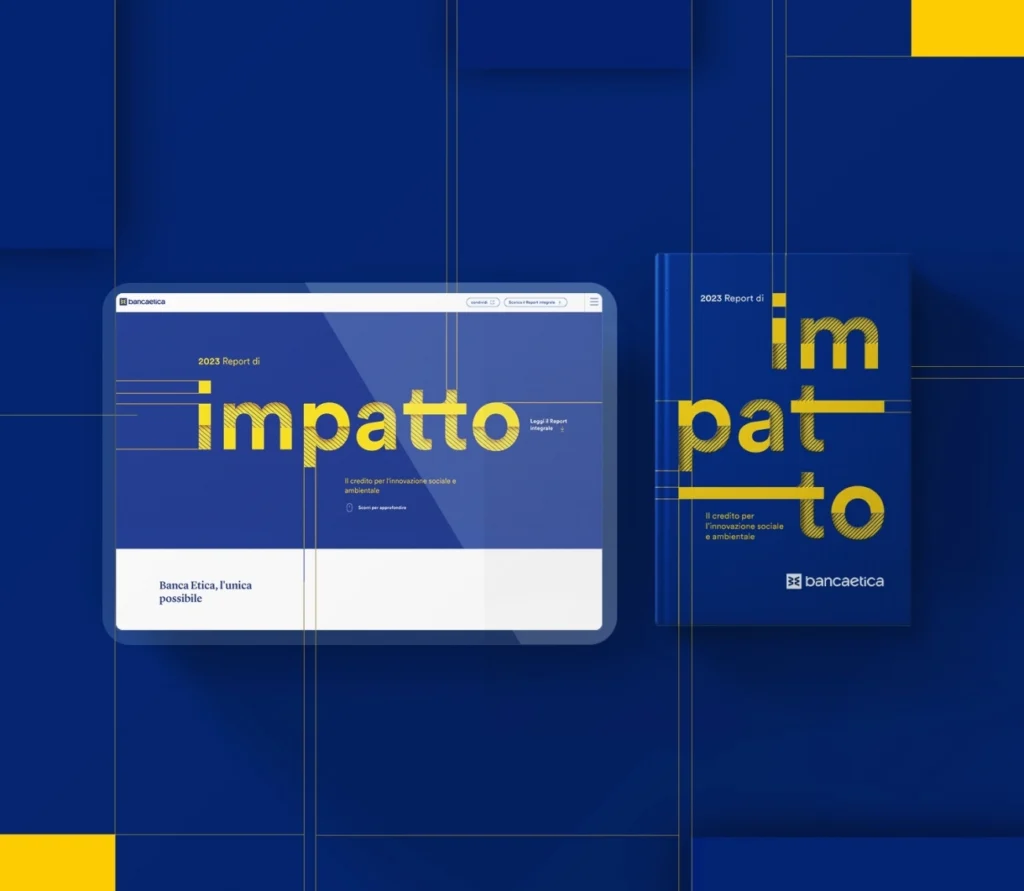
Comparative workshop The initial workshop conducted with the client was instrumental in defining the project’s objectives for both the static and digital output, along with structuring data in the most suitable manner. As a result, the look & feel and type of data visualization have been specifically designed to enhance the accessibility of the content […]

