An accessible guide to the Italian Constitution
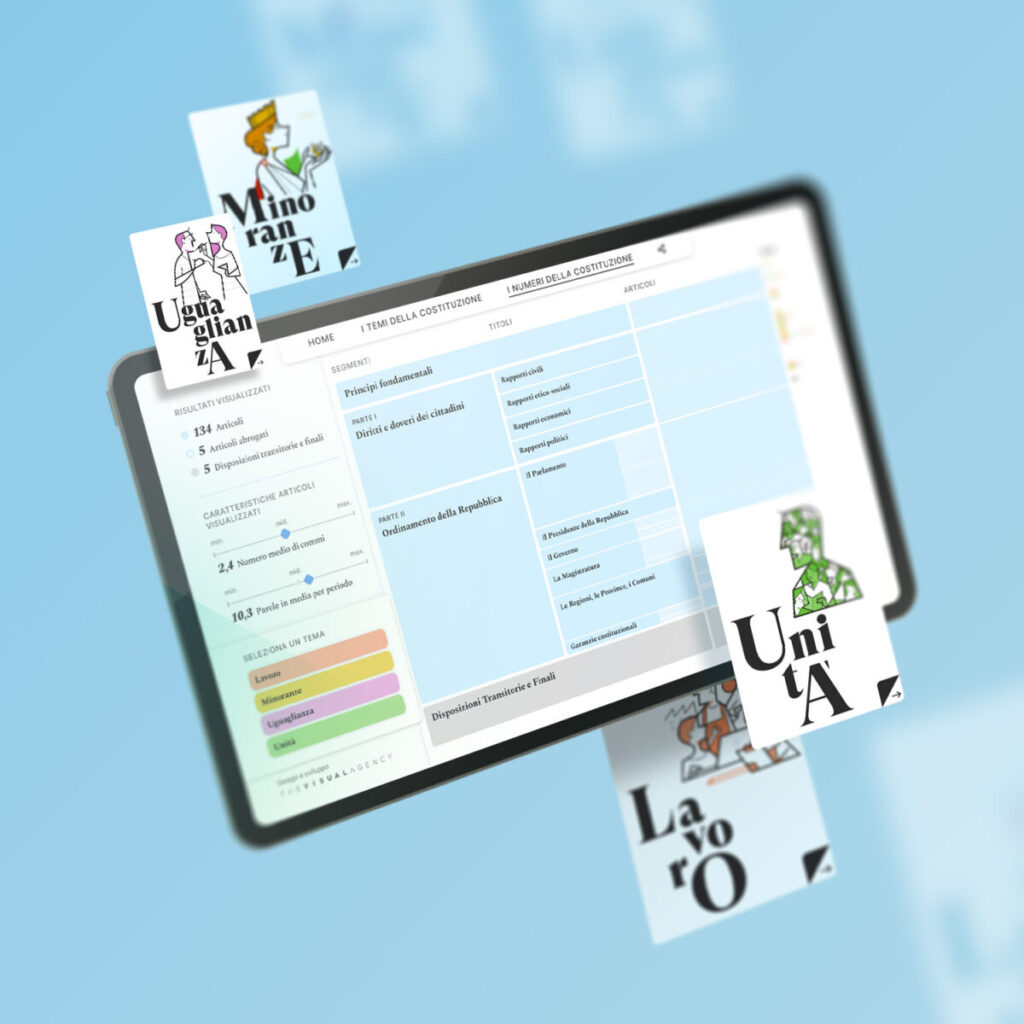
Accessible organization of resources Through the use of data visualization, we were able to enhance the information of an historical and complex document like the Constitution. Our team collaborated with WITHUB in the initial phase of the project to define the flow of information and conduct content research. Subsequently, we highlighted the most relevant themes […]
Reorganizing the information assets of a banking group
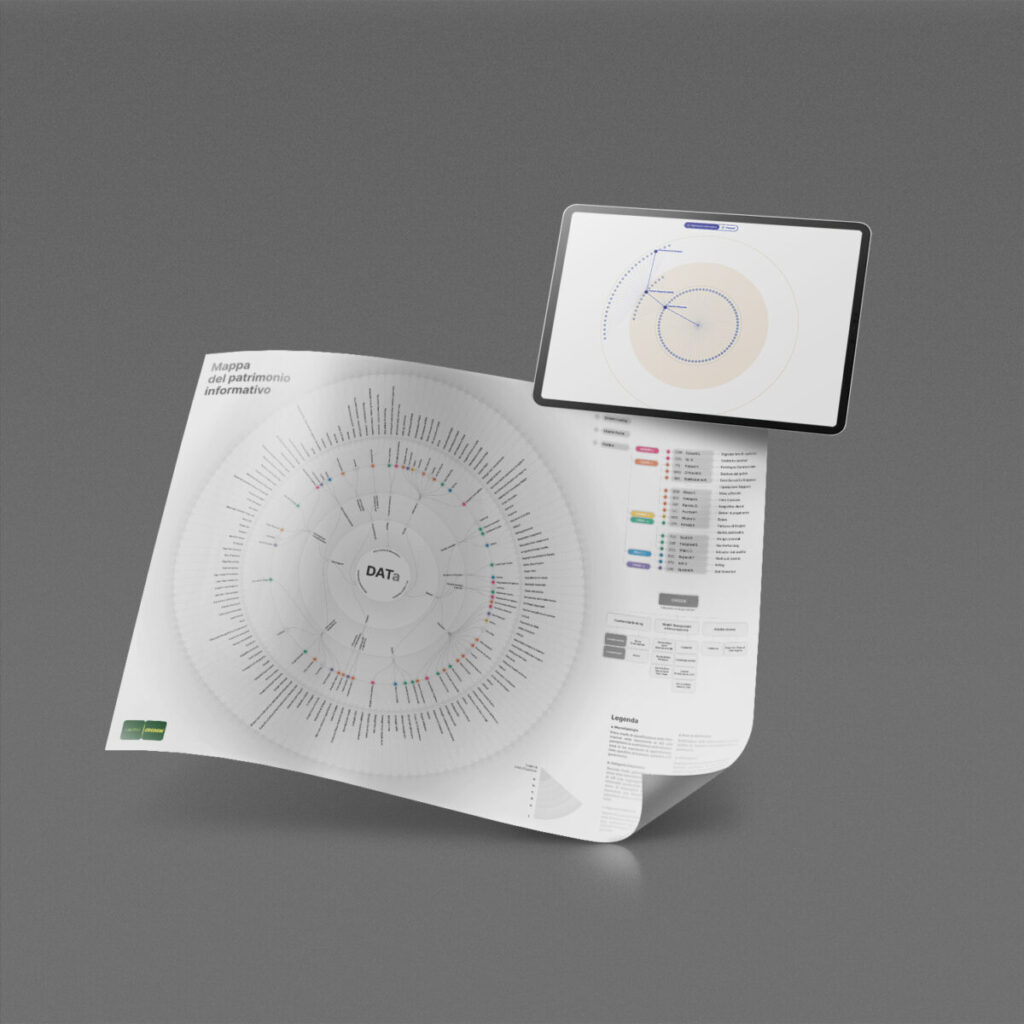
A user-centered approach The design of this interactive dashboard, developed in close collaboration with the client, is purely based on the user’s needs. For this reason, several user experience tools (personas, user flow, information architecture, etc.) were used to analyze and test usability. In this way, it was possible to develop a dashboard with a […]
Visualizing the information governance processes

A scalable view Our team has re-organised internal processes and activities into a dashboard, dividing them into macro phases, phases and subphases, down to the specific activity level. This method allows for easy and continuous updating of the dataset without ever modifying the structure of the original matrix. https://thevisualagency.com/wp-content/uploads/2025/06/Works_CRD4_VID-1.mp4 From general to specific The dashboard […]
Mapping companies’ logistics at the time of Covid-19
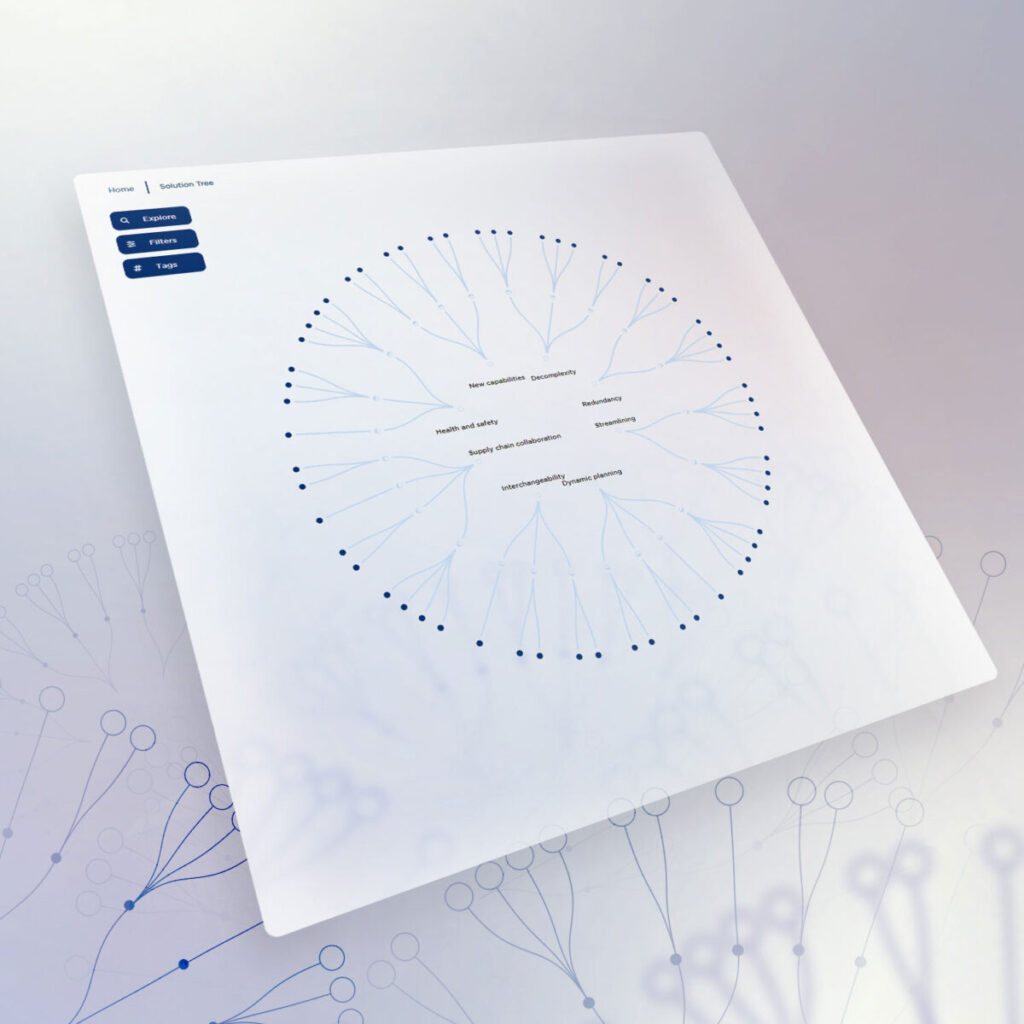
An explorable map In order to make the map easy to consult, its format was designed according to the nature of the data to be represented. It was thus decided to use a circular dendrogram, capable of visually organizing the data into categories and subcategories. Adaptability Adaptability is a key element for the client. Thanks to the […]
Data painting for energy transition
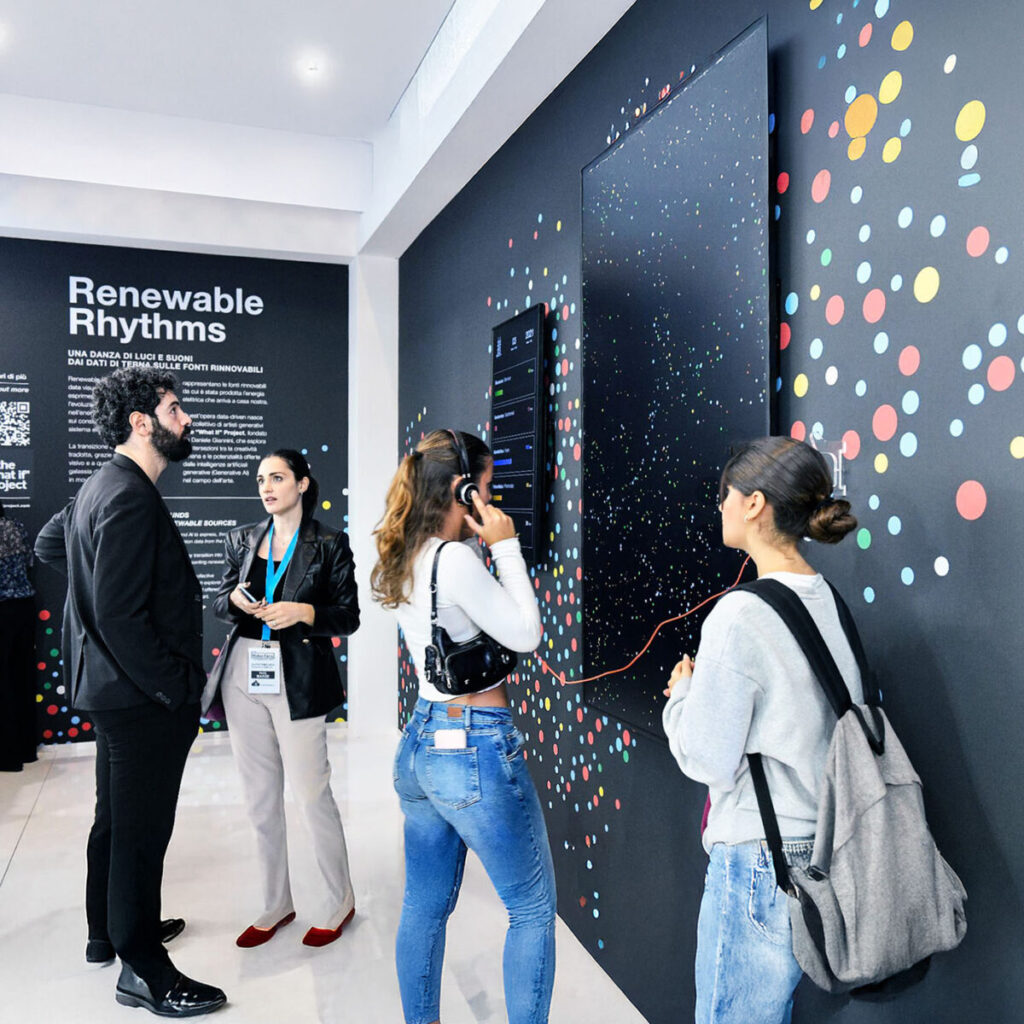
https://thevisualagency.com/wp-content/uploads/2025/06/TVA_Website_TER4_Asset_2_compressed.mp4 Accessible and engaging storytelling The longform designed by The Visual Agency, with text written and curated by Dalk, combines theoretical insights with technical explanations to explore Renewable Rhythms. On one hand, the theoretical section reflects on the ethical and creative use of datasets, drawing connections to other artistic projects. On the other, it delves […]
An interactive atlas for operational mapping

Immersive exploration on every screen The map offers an immersive exploration experience through an 86-inch screen and a comprehensive view of the data. With the touch-zoom feature, users can effortlessly zoom in and out using a simple two-finger gesture, granting swift access to every corner of the globe. Whether navigating through vast regions or focusing […]
Bespoke Solutions

MyVerco SaaS platform for carbon accounting
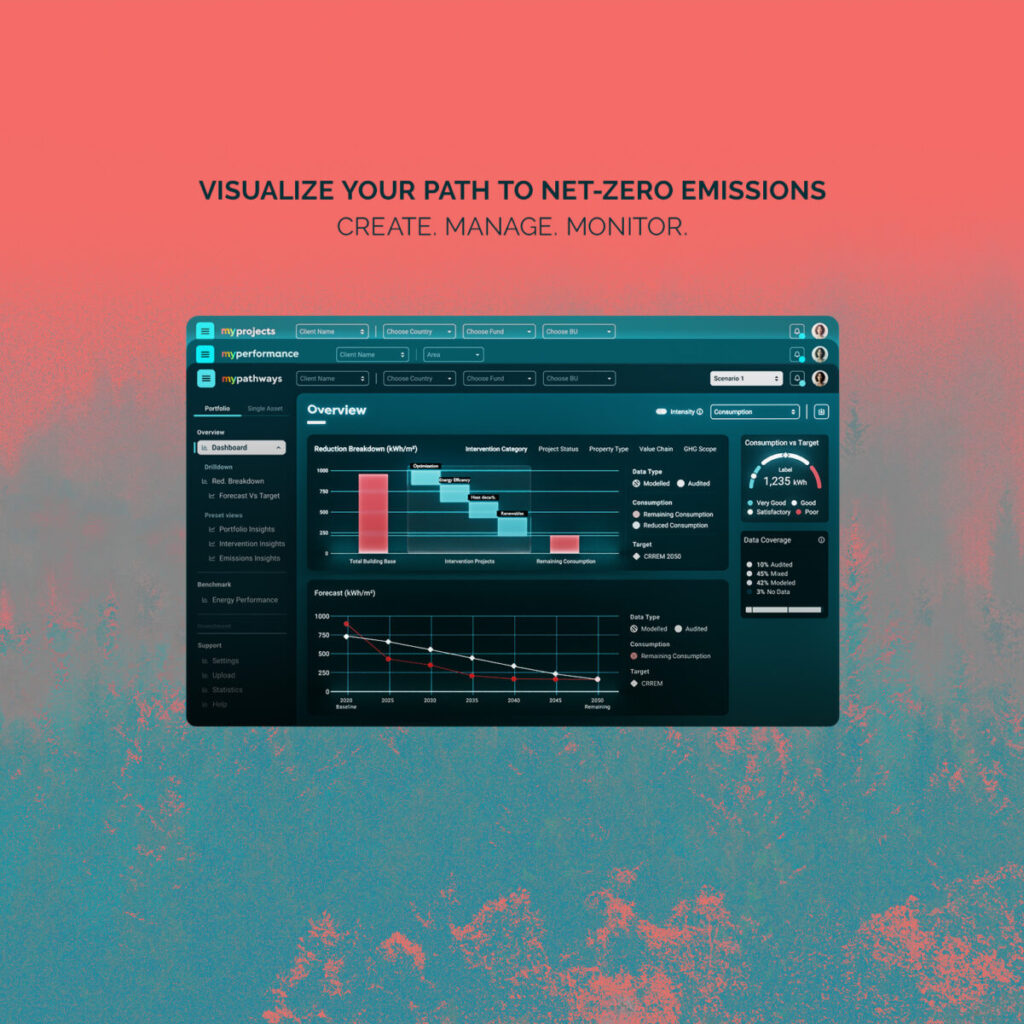
https://thevisualagency.com/wp-content/uploads/2025/06/MyVerco_Assets-1_3.mp4 Comprehensive sustainability data MyVerco’s interconnected dashboards provide a 360-degree view of sustainability metrics across energy use, project management, and emissions forecasting. These dashboards, designed with The Visual Agency’s expertise in data interpretation and the creation of intuitive visualizations, simplify a complex subject without sacrificing insights or content. This approach delivers all information in one […]

