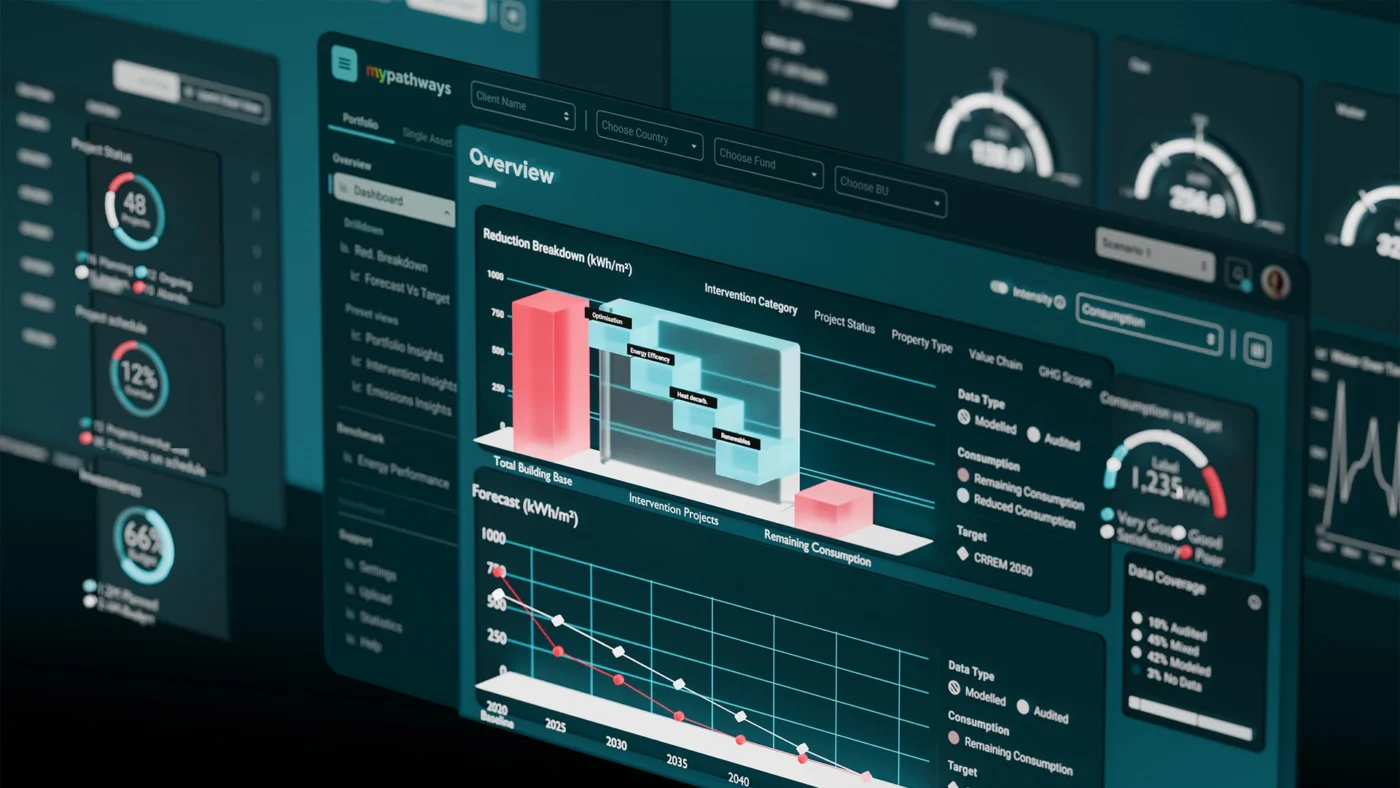
Dashboards that turn complex data into actionable insights and powerful visualizations to support business strategy
Dashboards and Data Visualization
The integration of data visualization and digital design within dashboards enables businesses to transform raw data into meaningful narratives. This approach allows users to discern patterns, anomalies and trends, enhancing their ability to make informed decisions based on the data presented.
How to Design a Dashboard for Effective Data Visualization
The design of a successful dashboard necessitates a deep understanding of both qualitative and quantitative data.
At The Visual Agency, we specialize in data visualization design, ensuring that our dashboards are both highly functional, accessible by design and visually appealing, facilitating ease of interpretation for a wide range of users. The Visual Agency brings extensive experience in accessible dashboard data visualization across industries such as media, energy, life sciences and fashion.
Whether you’re looking for guidance on how to make a dashboard or seeking inspiration from dashboard visualization examples, we offer tailored solutions that align with your specific goals. Our process includes conducting workshops to gather stakeholder input and developing a clear information architecture to ensure the dashboard is both functional and scalable. With a focus on UX/UI digital design, we ensure an intuitive user experience, supported by rigorous user testing to refine functionality. Our dashboards not only provide actionable insights but also promote efficient and sustainable data management practices.
Our Projects
-
Dashboards and data visualization
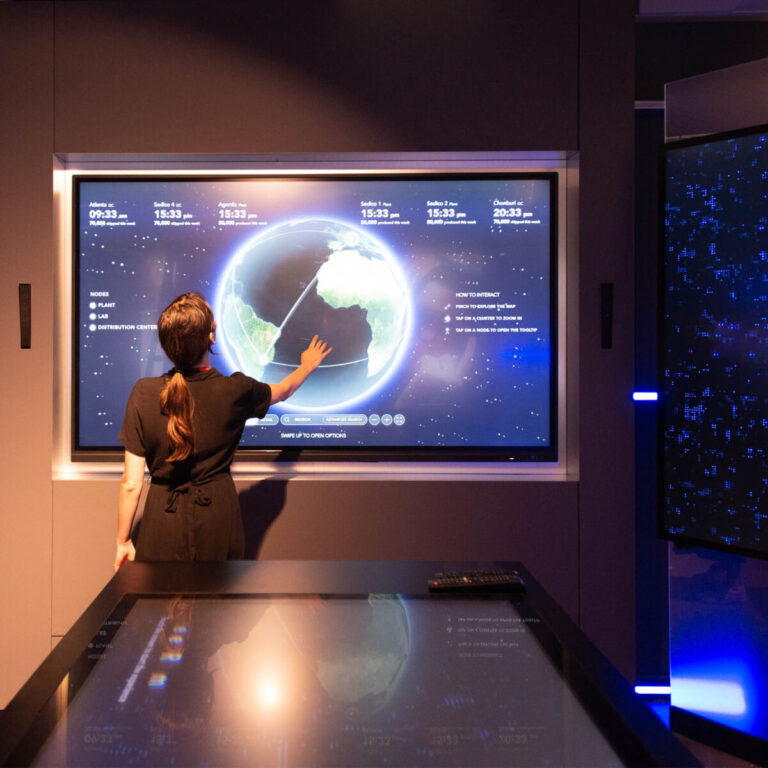
An interactive atlas for operational mapping
Biblioteca Ambrosiana
Dashboards and data visualization
Decoding Leonardo Da Vinci for the world
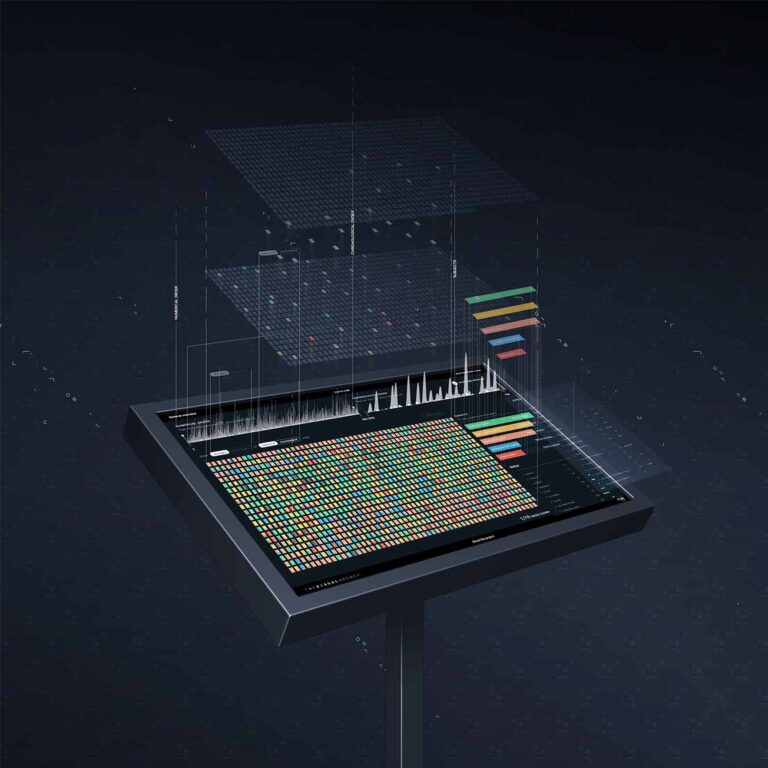
TVA
Dashboards and data visualization, Data-storytelling
A digital collection to experience Dante’s Divine Comedy
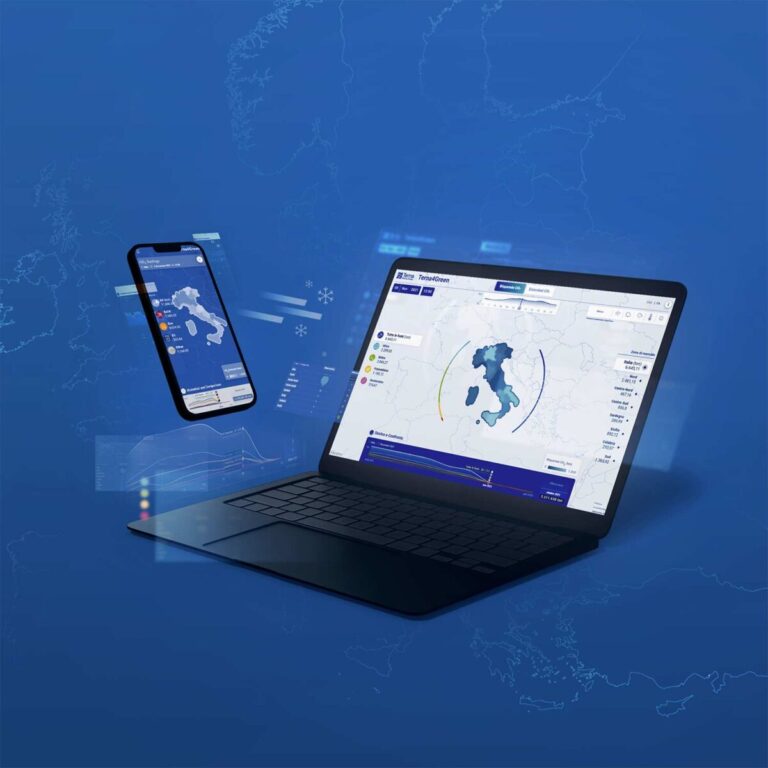
Terna
Dashboards and data visualization
A digital platform to guide energy transition
Terna
Dashboards and data visualization, Sustainability reporting
An immersive platform to communicate sustainability
Gs1
Dashboards and data visualization
Mapping companies’ logistics at the time of Covid-19