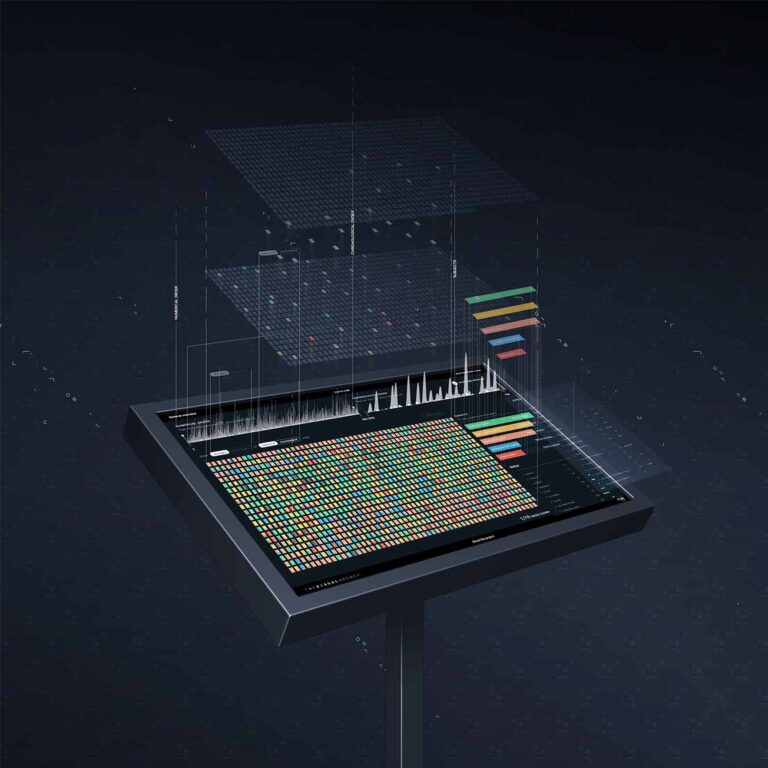
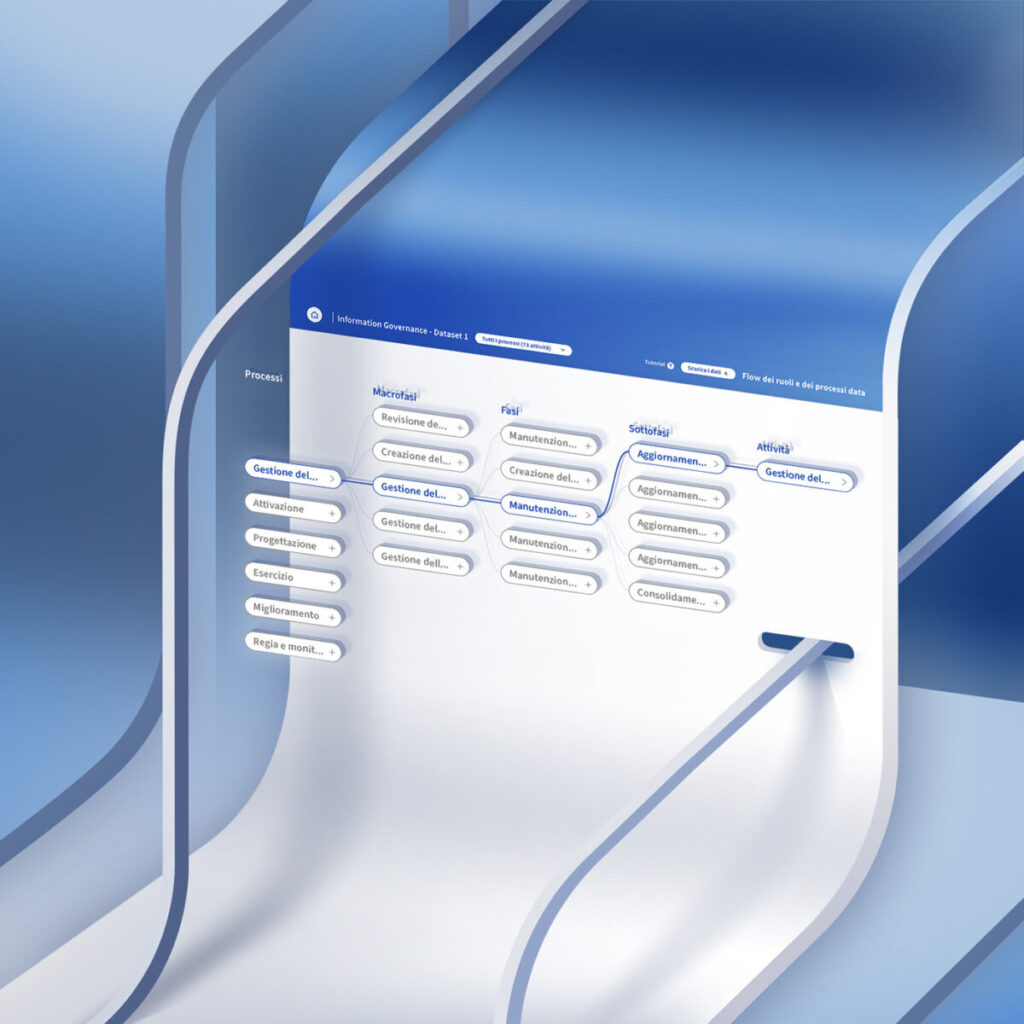
Client:

Credem

Solution:

Dashboards and data visualization

Visualizing the information governance processes

A digital flowchart displays interconnected process steps in Italian, categorized by "Macro fasi," "Fasi," "Sottofasi," and "Attività."

Description

Background

Credem needed a tool to explore in a simple and informative manner, how activities, roles and responsibilities are distributed across the entire organization. To respond to this need, The Visual Agency developed a dashboard that maps the information governance process providing an effective visualization of a large and complex dataset. The use of additional filters enables faster and more flexible navigation through a modular structure, with focus on single activities. The whole system is designed to be updated easily, making it accessible and extremely user-friendly.

Re-organize internal data related to people’s roles, responsibilities and areas of expertise in order to facilitate an overall view of the information governance processes.

A dynamic dashboard to display processes and activities in a clear and scalable way. Through the implementation of targeted filters the dashboard effectively highlights roles and responsibilities.

The Visual Agency developed an interactive dashboard for Credem, highlighting through specific filters, a modular structure of the information governance processes. The result is a user-friendly tool that provides a comprehensive view.

A digital flowchart displays interconnected process steps in Italian, categorized by "Macro fasi," "Fasi," "Sottofasi," and "Attività."

Year:

2023

Industry:

Finance

A scalable view

Our team has re-organised internal processes and activities into a dashboard, dividing them into macro phases, phases and subphases, down to the specific activity level. This method allows for easy and continuous updating of the dataset without ever modifying the structure of the original matrix.

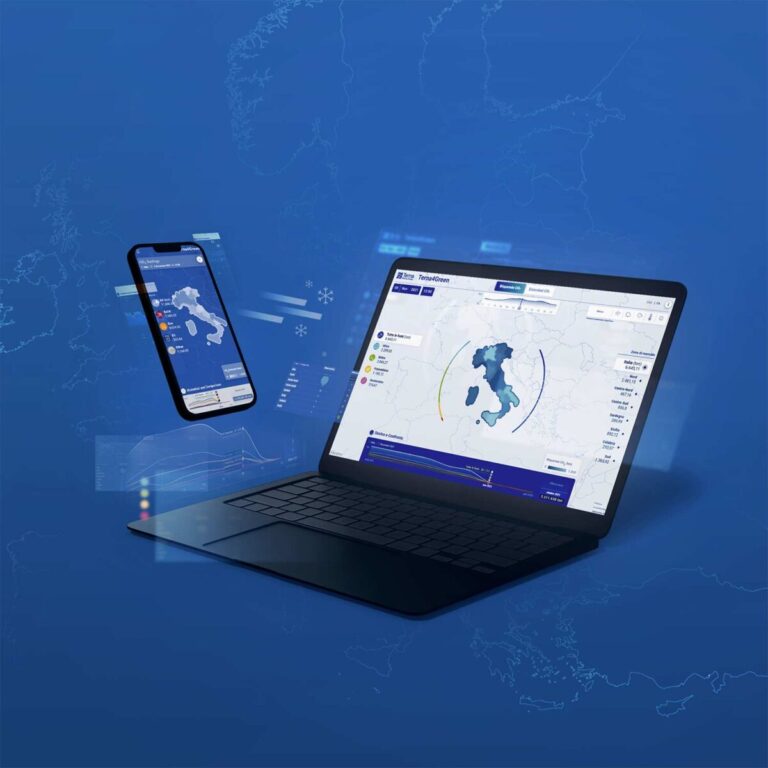
From general to specific

The dashboard is provided with a set of filters that allow searching for either a generic keyword or a specific role or responsibility. Within the activities it is possible to view not only the detailed description but also the relevant RACI classification for the identified position.
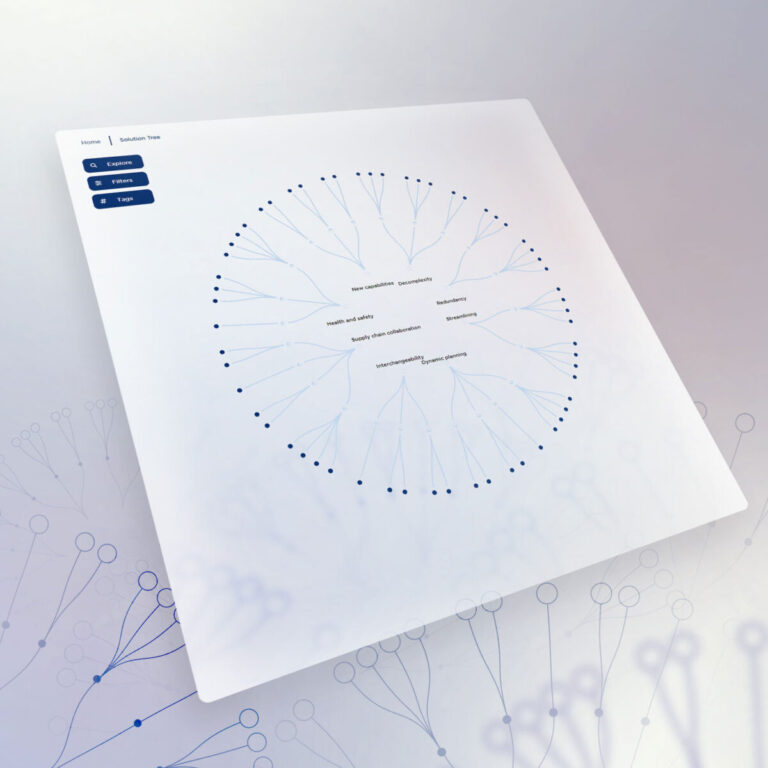
Guided exploration

The dashboard uses pop up messages to guide the exploration process, providing clear navigation, highlighting key features and ensuring a highly user-friendly experience.

Our Projects

COVER 1500
IMG 1304_cover
TVA Website_D700_COVER 1500 x 1500 px
TER2_TernaCO2_Cover 1500
TER3_COVER 1400
COVER 1500 px

We’d love to hear about your project! Drop us a line