Client:

Corriere della Sera

Solution:

Data-storytelling

Sunday read: story-telling through complex data visualization

Description

Background

We propose and design cutting-edge data visualizations for La Lettura, the Sunday insert of the Corriere della Sera newspaper. This special section, titled Visual Data, is dedicated to explaining and exploring topics of common interest through complex infographics.

Enhance the newspaper’s storytelling and informative capacity by presenting complex information in eye-catching visualizations.

The evolution of the collaboration between The Visual Agency and Corriere della Sera is a proof point for the impact data visualization has had for story-telling in a time when data and information access is growing exponentially. The Visual Data section has allowed the publication to transition into the digital age, keeping its readership engaged in current affairs through intriguing visualizations.

Internationally awarded collaboration with Italy’s leading newspaper Corriere della Sera. The Visual Agency has been designing cutting-edge visualizations on current affairs, politics and culture since 2013.

Year:

2018

Industry:

Education & Culture

A newspaper displays a large data visualization infographic about flights to London, with circular and bar charts, on a red background.

Visual Data

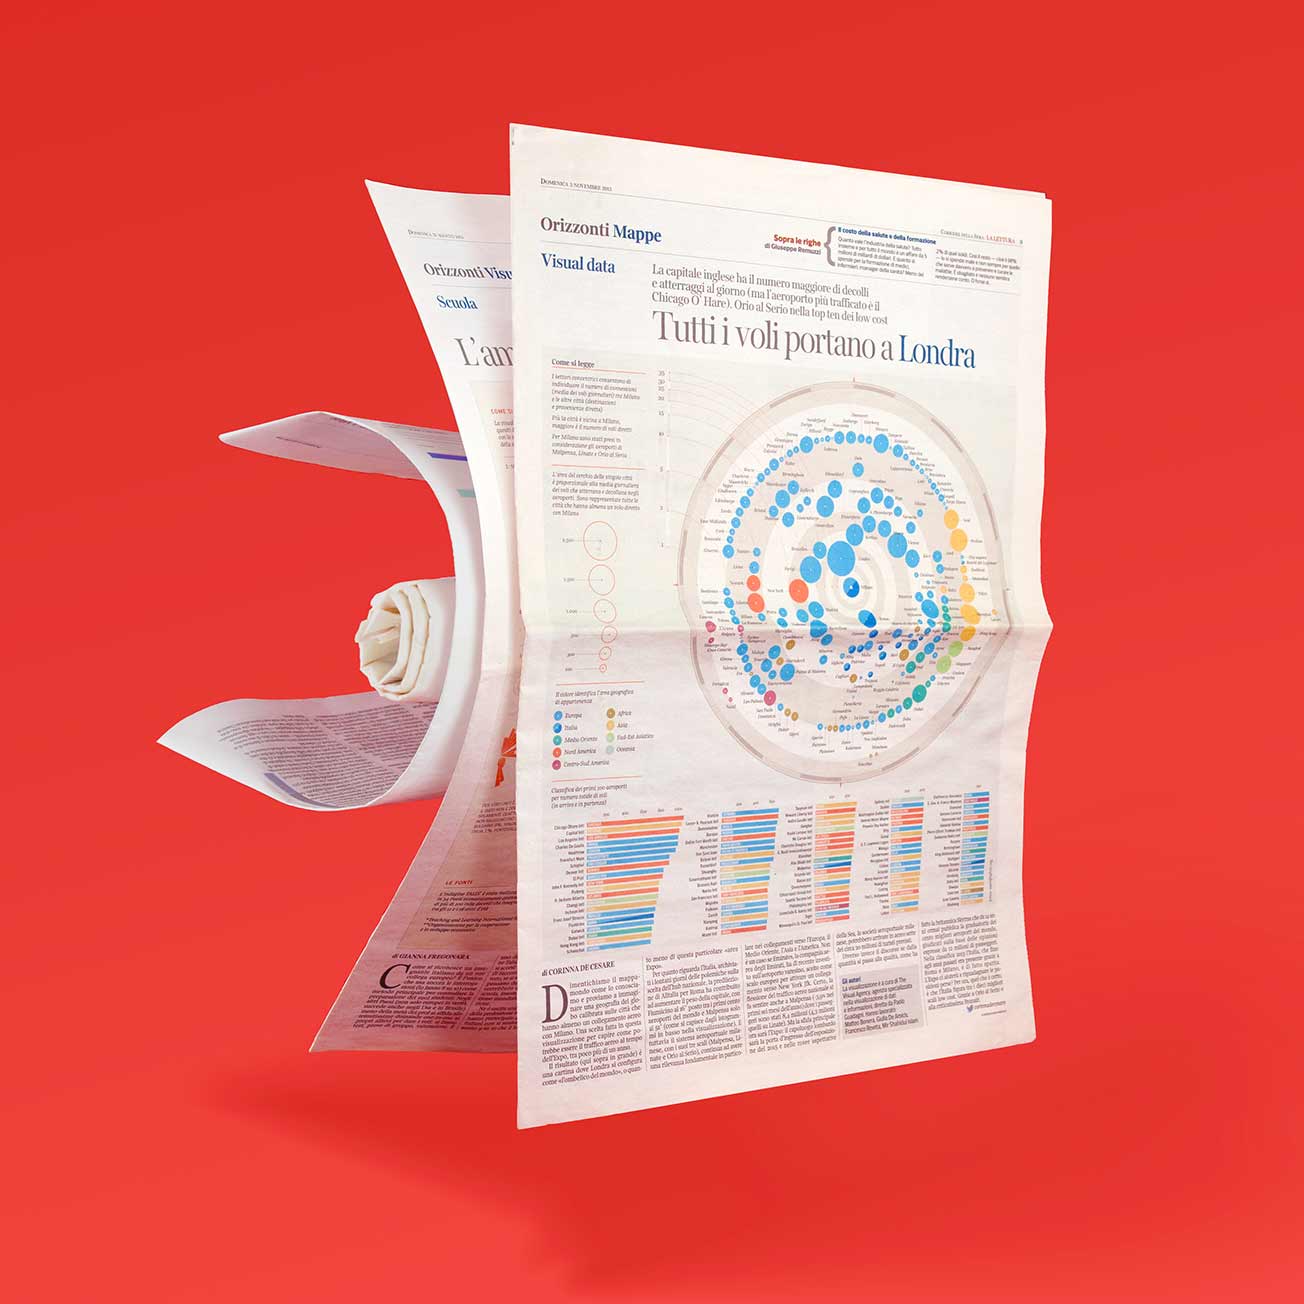
Visual data was launched in February 2018. The Visual Agency’s collaboration with Corriere della Sera however, dates back to 2013. Since the beginning of this partnership, we have created a large number of static and interactive visualizations both for the print and online newspapers.

The process

Our work for Corriere della Sera includes the selection and suggestion of content and topics to the editorial staff, collecting and analyzing data and creating complex visualizations thereafter.

A radar chart infographic from Corriere della Sera shows various countries and data percentages in concentric circles.
members of The Visual Agency celebrate the Information Is Beautiful Award 2015
A framed newspaper infographic, seen at an angle, features a grid of colored squares and Italian text on a light background.

The first interactive visualization

The Visual Data of La Lettura, the section of the Sunday insert of the Corriere della Sera dedicated to the infographic, was launched for the first time online in February 2018. We created an interactive visualization in collaboration with Google – where we have tracked and visualized what Italians have been searching on Google during 2017.

The project rewards the collaboration that we hold with the Corriere della Sera on the side of infographics, which began in 2013 in the paper and today involves also the online section of the Italian newspaper.

“Series of numerical correlations become the protagonists of a new way of making information, which involves the reader. The most advanced graphic design resources meet journalism: the coordinates of a new aesthetic of knowledge are drawn, with a new idea of creativity”.

Le Mappe del Sapere exhibition, Triennale, Milan.

A framed newspaper infographic, seen at an angle, features a grid of colored squares and Italian text on a light background.
View of the exhibition about our work for La Lettura at La Triennale Milano

The Triennale museum

Within the exhibition Le mappe del sapere, professor Paolo Ciuccarelli, Alberto Cairo and Daniela Piscitelli – three dear friends of The Visual Agency – discussed the importance of data and journalism.

An awarded project

Our projects have been awarded at many international contests: the Malofiej in Pamplona, the Information is beautiful Award in London and the Ed Awards in Wien.

Our Projects

People engaging with an interactive art installation titled "Renewable Rhythms" at an exhibition.
TVA Website_D700_COVER 1500 x 1500 px
COVER Campari Data Culture_quote
MUS1_COVER 1500
ENI12_PRX 1400

We’d love to hear about your project! Drop us a line