Mapping companies’ logistics at the time of Covid-19
Description
Background
GS1 Italy, the only Italian body authorized to issue barcodes, wanted to illustrate 60 logistic solutions adopted by 21 Italian companies to ensure business continuity during the Covid crisis. The Visual Agency designed a map that can be easily explored by all the stakeholders of the organization and is capable of adapting to the characteristics and needs of different devices and users.
Objective
Creating an interactive and easily explorable map of the logistic solutions adopted during the Covid-19 pandemic.
Result
The creation of an interactive map that is simple and intuitive to use has made communication with stakeholders particularly effective.
The Tree of Business Continuity Solutions catalogues and visualizes 60 logistics solutions deployed during the pandemic to ensure business continuity in the FMCG sector: an account of emergency management on the one hand, a common heritage for the future on the other.
Year:
2021
Industry:
Professional Services
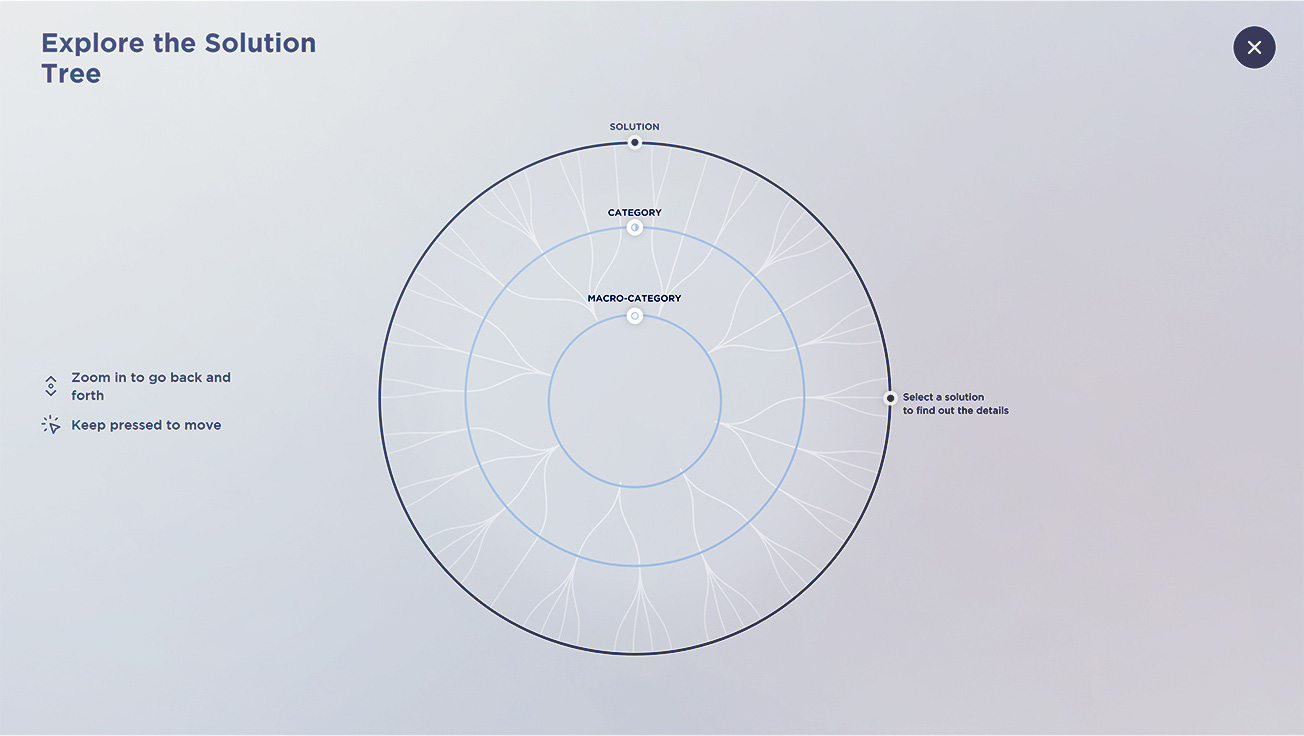
An explorable map
In order to make the map easy to consult, its format was designed according to the nature of the data to be represented. It was thus decided to use a circular dendrogram, capable of visually organizing the data into categories and subcategories.
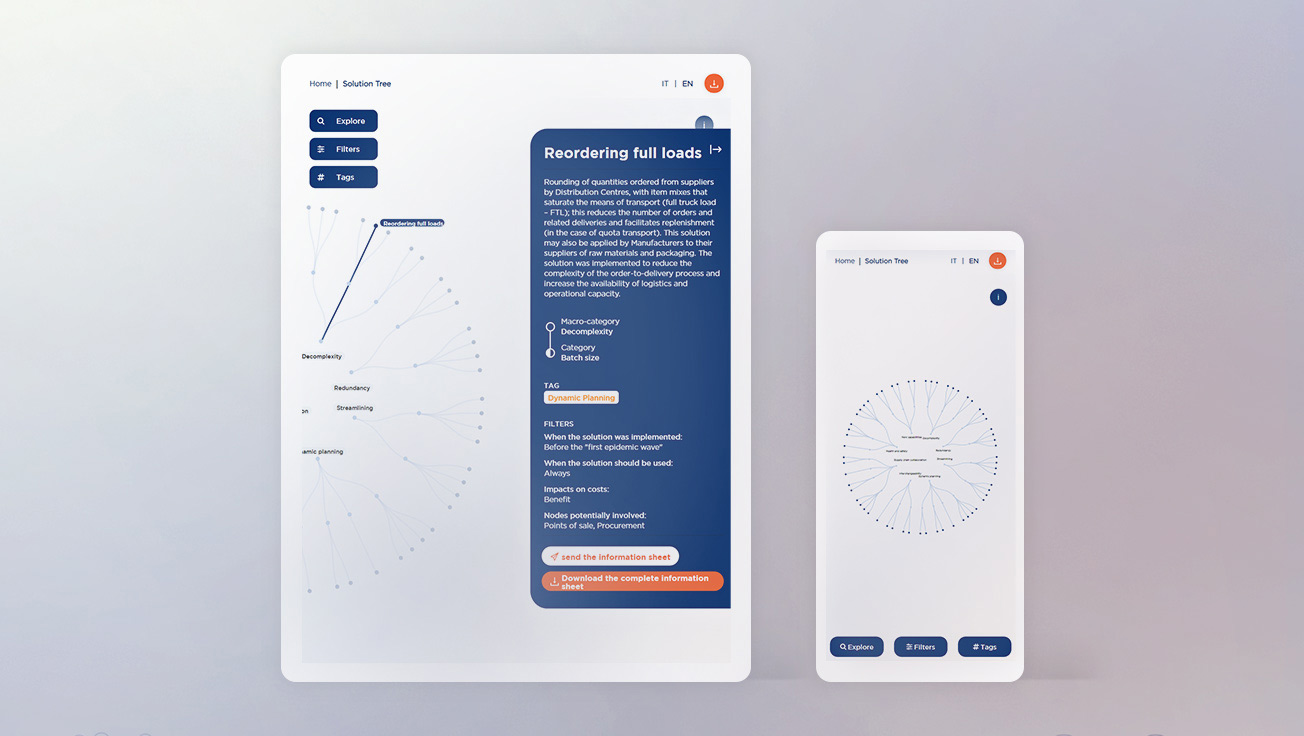
Adaptability
Adaptability is a key element for the client. Thanks to the zoom on the right, it is possible to adapt the display to different screen sizes: from tablet and mobile to desktop and large screens used at trade fairs and conferences.
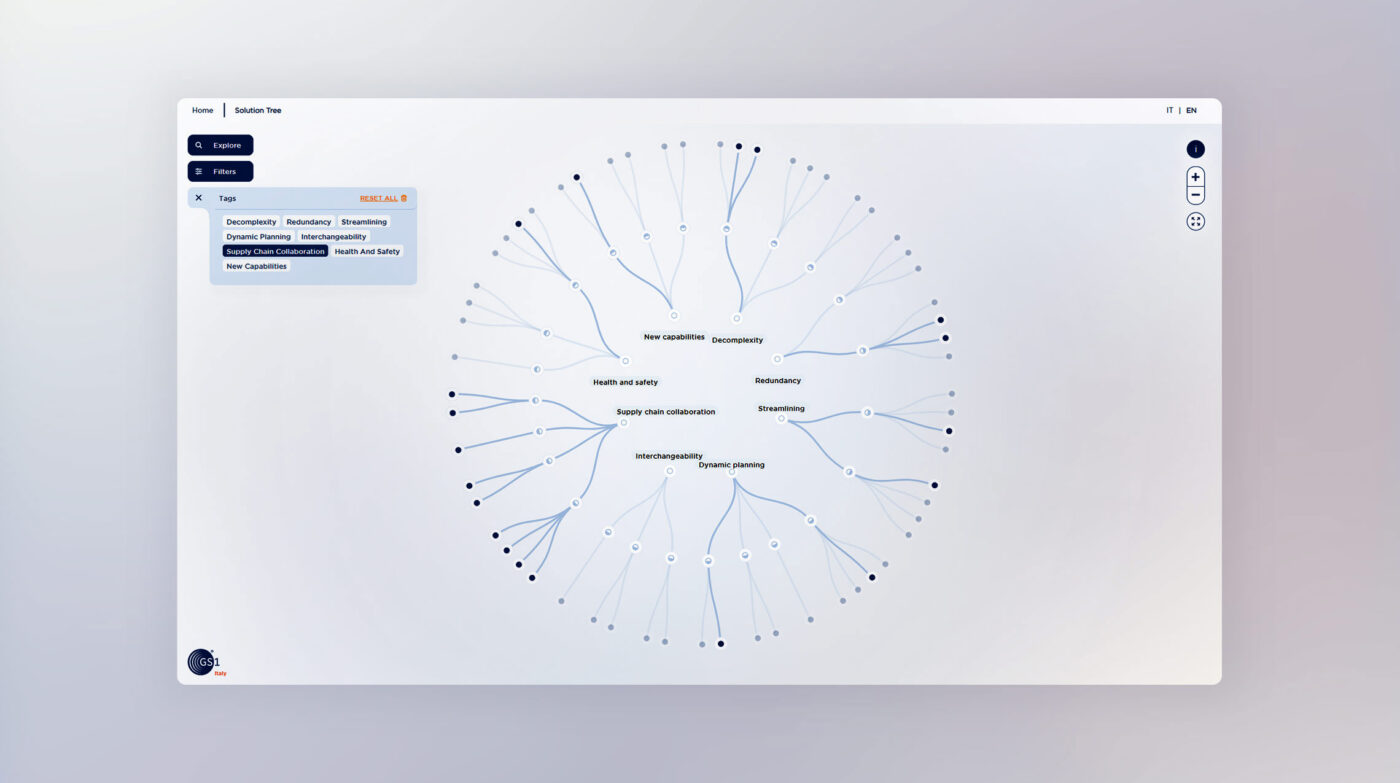
Filters and navigation
The 60 solutions have been catalogued in 8 macro-categories and 24 categories. Each level can be selected and filtered, so as to provide an overview of the solutions belonging to each category. This creates a homogeneous narrative and offers a useful and intuitive tool for the future.
Our Projects
-
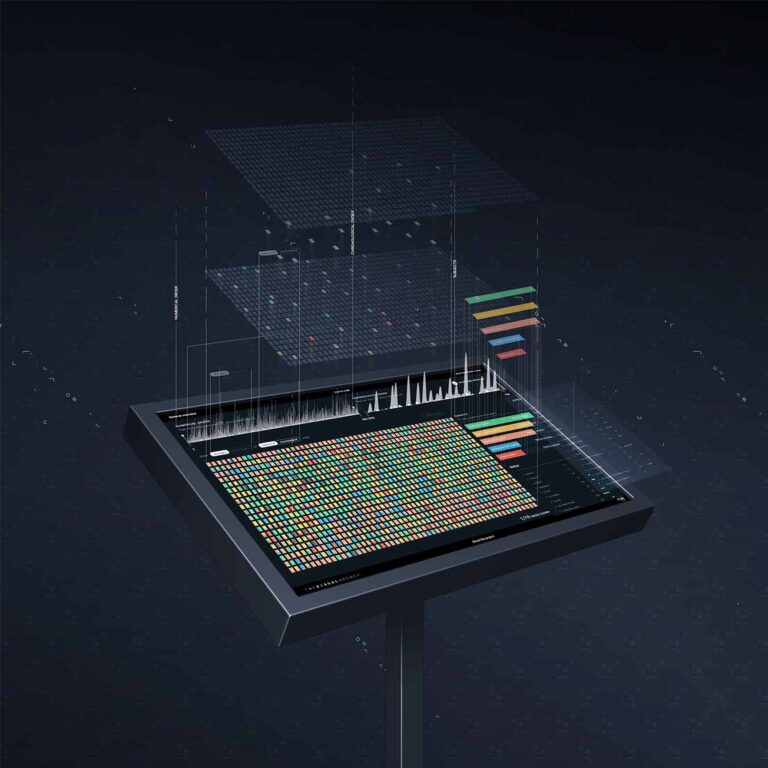
Dashboards and data visualization
An interactive atlas for operational mapping
Biblioteca Ambrosiana
Dashboards and data visualization
Decoding Leonardo Da Vinci for the world
TVA
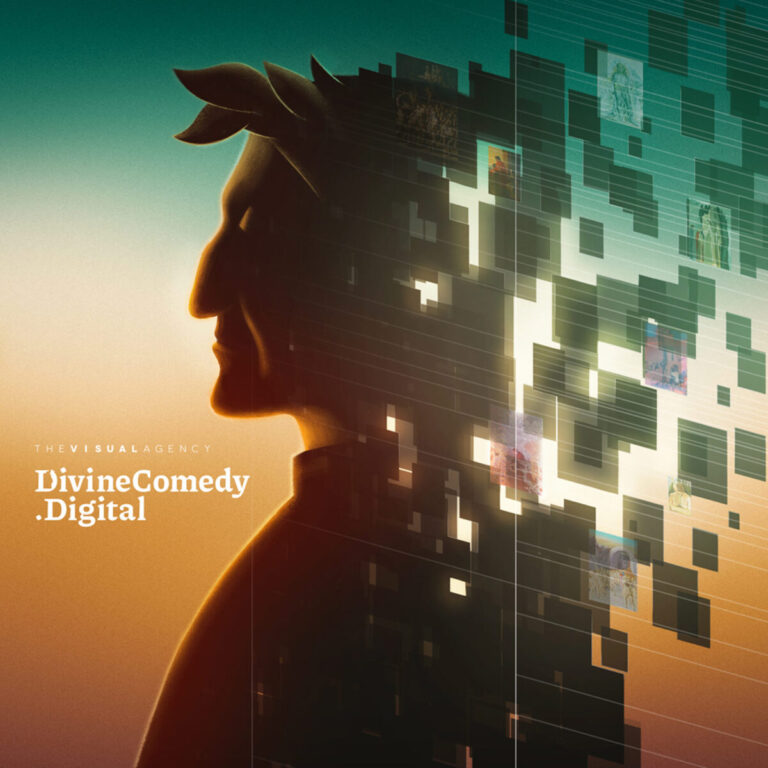
Dashboards and data visualization, Data-storytelling
A digital collection to experience Dante’s Divine Comedy
Terna
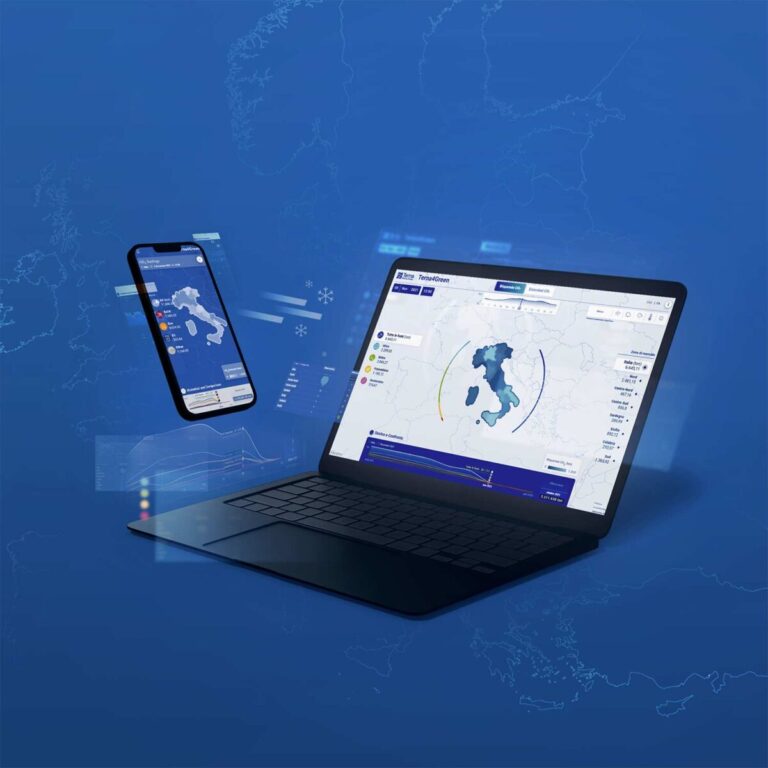
Dashboards and data visualization
A digital platform to guide energy transition
Terna
Dashboards and data visualization, Sustainability reporting
An immersive platform to communicate sustainability
Credem
Dashboards and data visualization
Visualizing the information governance processes
No posts found
We’d love to hear about your project! Drop us a line