Client:

Snam

Solution:

Sustainability reporting

Communication ecosystem for corporate sustainability

Description

Background

For the second year of collaboration with Snam, The Visual Agency created a communication ecosystem comprising a digital report, static report, and social media assets. Each output was designed to empower Snam’s communication by utilizing interactive graphics, data visualization, and modular structures, improving clarity, accessibility, and consistency. By maintaining a unified graphic line and emphasizing a clean, clear interface, we ensured that the “Sustainability Profile” was effectively communicated across all platforms, providing a seamless and engaging user experience.

Create a concise, user-friendly sustainability report in both digital and print versions, including assets for social media communication.

The publication of this report marks the relaunch of Snam’s commitment to the area under the auspices of its new ambition, geared towards developing “energy infrastructure for a sustainable future”.

To enhance communication for Snam’s “Sustainability Profile”, The Visual Agency designed three distinct outputs. Each output has unique features tailored to its specific purpose. Together they form an agile, user-friendly and consistent ecosystem that engages and speaks to a diverse set of audiences.

Year:

2024

Industry:

Energy

Sustainability Profile 2023 report displayed with surrounding decorative spheres, emphasizing ecological themes.

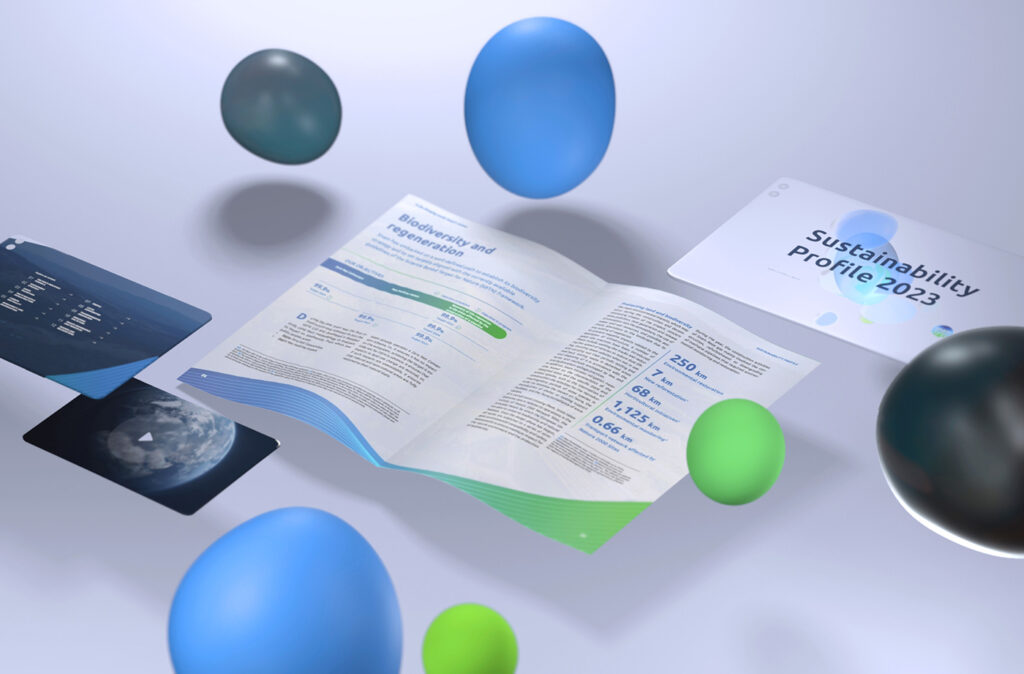
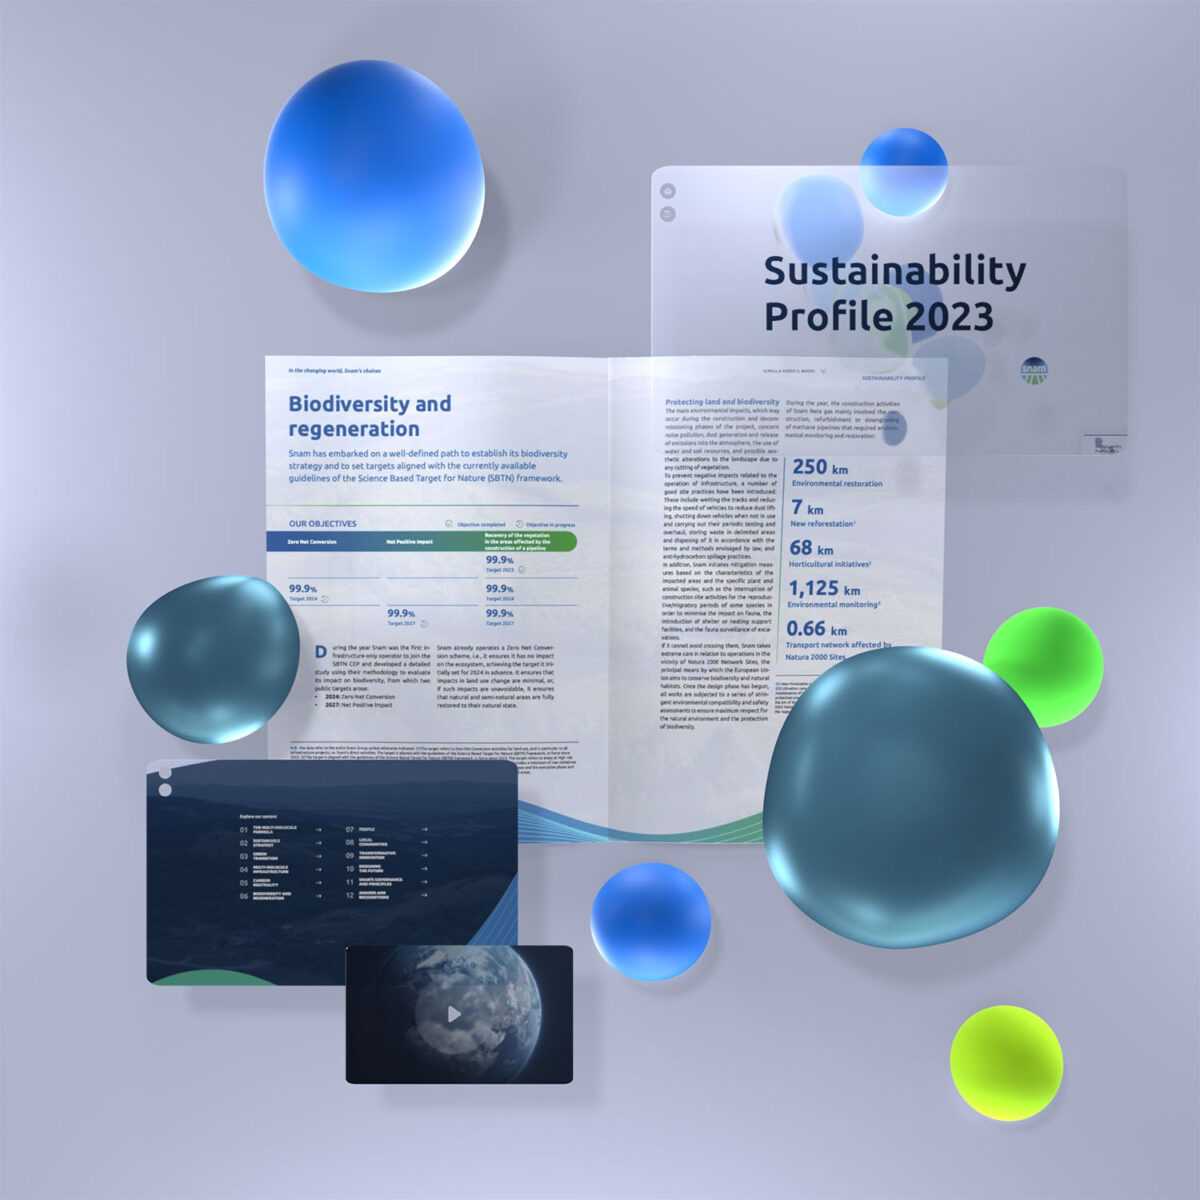
Three outputs for enhanced user engagement

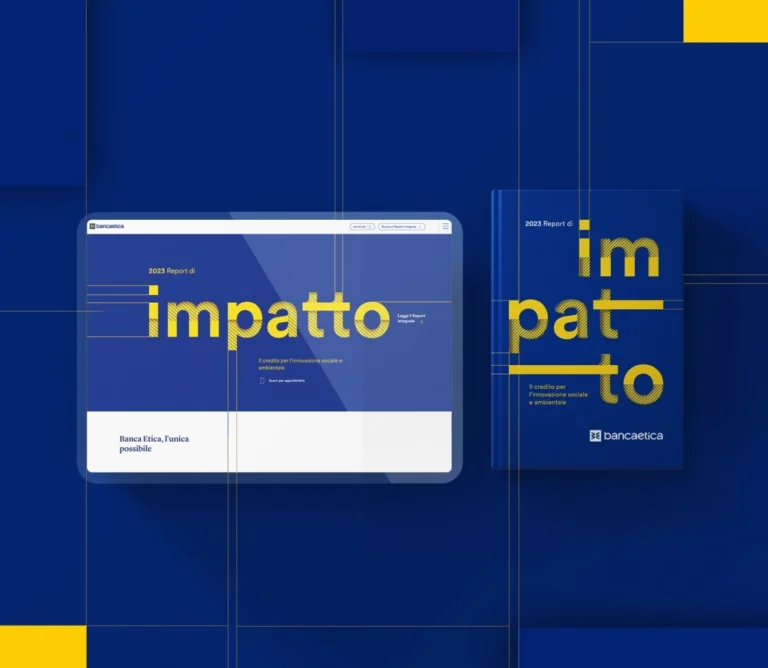
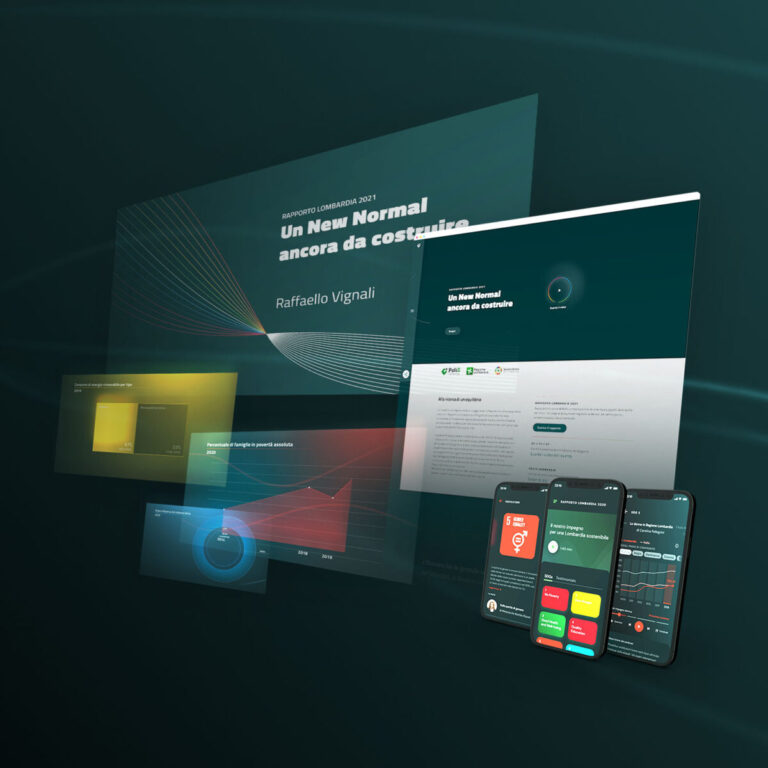
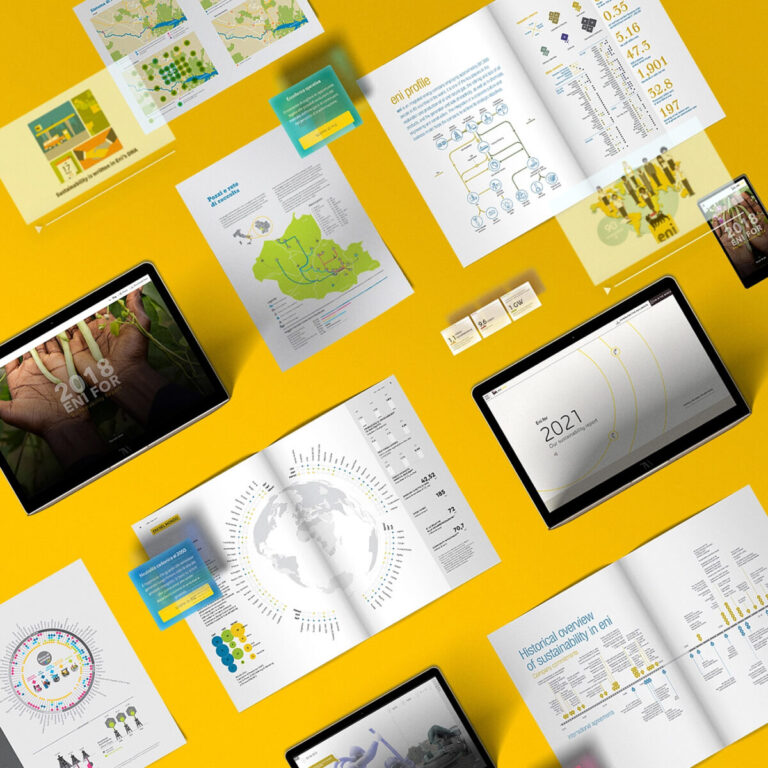
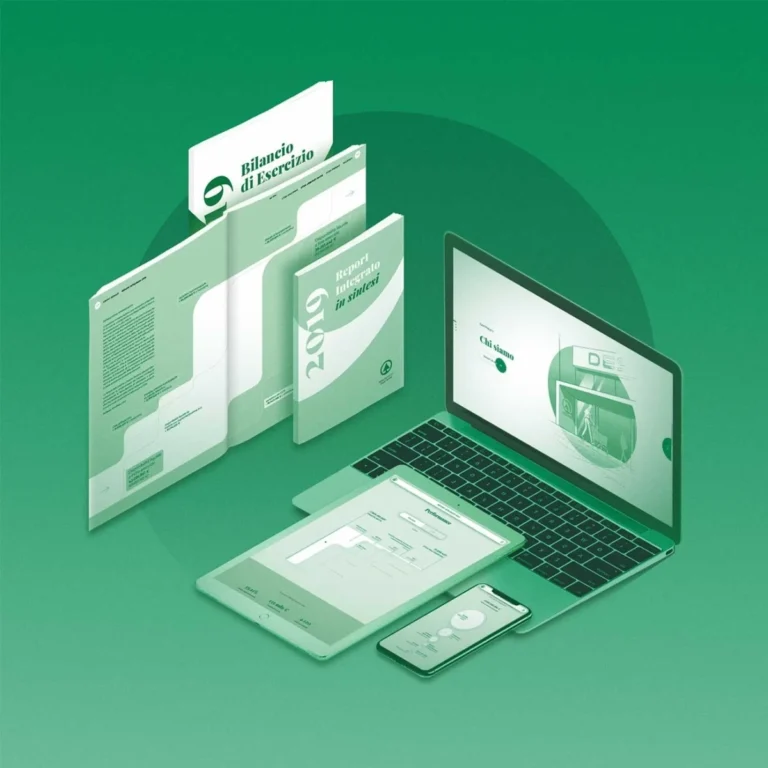
We began with the static report, characterized by a clear organization of information supported by KPIs, graphs, and engaging visualizations. We then introduced the digital report which enhanced its communicative power thanks to its immediate and easy exploration, making the consumption of information more effective and engaging. The third output, a social media video and 10 social cards, targets a young audience, extending the communication reach and ensuring that the message is conveyed across all platforms and demographics in a consistent manner. 

Simplified data visualization

Our specialized information design team focused on organizing the content on all three outputs. The extensive amount of information was divided and restructured into easily distinguishable modular sections. Within these sections, recurring and recognizable elements were created to support navigation, making the document easier to use.

Improved accessibility and navigation

On the digital report we integrated interactive charts and engaging visualizations to make the information clearer and more accessible, complying with accessibility standards and ensuring a clean interface. Navigation is optimized to offer a smooth and intuitive user experience. The site is fully responsive, allowing users to zoom in and customize their view through a pop-up feature, further enhancing the usability of the information.

Our Projects

cover banca etica
POL1_Polis_New Normal_cover_1500x1500
TER3_COVER 1400
Various digital devices and printed documents showing sustainability reports and data visualizations are spread across a yellow surface.
SYM1_COVER
Dedspar

We’d love to hear about your project! Drop us a line