Client:

-

Solution:

Dashboards and data visualization

An interactive atlas for operational mapping

Description

Background

The client needed a unified visualization to create a detailed map showing both position and relevant KPIs of their manufacturing plants, labs, distribution centers, and retail shops. Our team developed an interactive map that offers a comprehensive view of their operational infrastructure, aiding decision-making, logistics optimization, and resource coordination. By integrating these elements into a user-friendly interface with a rotating globe at the center, the client is now able to streamline management, improve situational awareness, and boost productivity and competitiveness.

Develop an intuitive and accessible interface on a large touch screen, to showcase substantial information about the production and distribution process.

A highly detailed interactive map that aggregates up-to-date information across critical operational and distributional activities. The inclusion of customized filters enriches the visualization, empowering top management to make informed decisions.

Our team developed an interactive touchscreen map customized for an 86-inch screen in the main meeting room, dedicated to facilitating strategic decision-making. This map empowers users to explore data from global operational and distribution divisions, providing detailed information through advanced filters.

Year:

2023

Industry:

Manufacturing and Retail

Immersive exploration on every screen

The map offers an immersive exploration experience through an 86-inch screen and a comprehensive view of the data. With the touch-zoom feature, users can effortlessly zoom in and out using a simple two-finger gesture, granting swift access to every corner of the globe. Whether navigating through vast regions or focusing on specific details of locations or areas of interest, the map ensures a seamless and engaging user experience on every device and format. 

A large screen in a dark room displays a digital globe with time zone information and other interactive elements
A person points at a large interactive screen displaying a digital globe with store locations and time zones

Dynamic interactive display

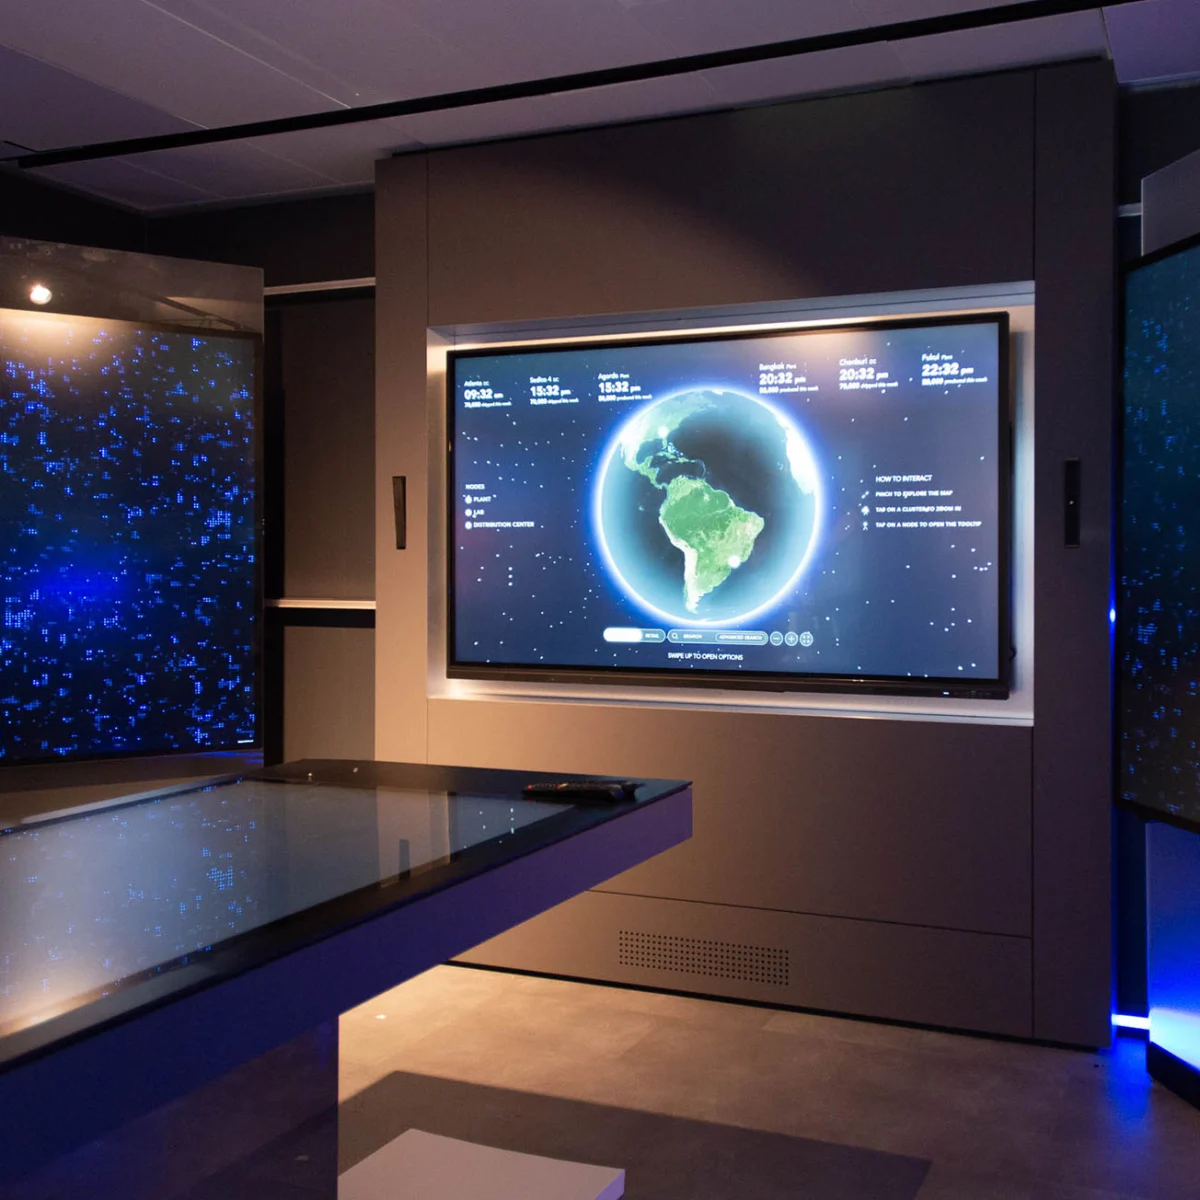
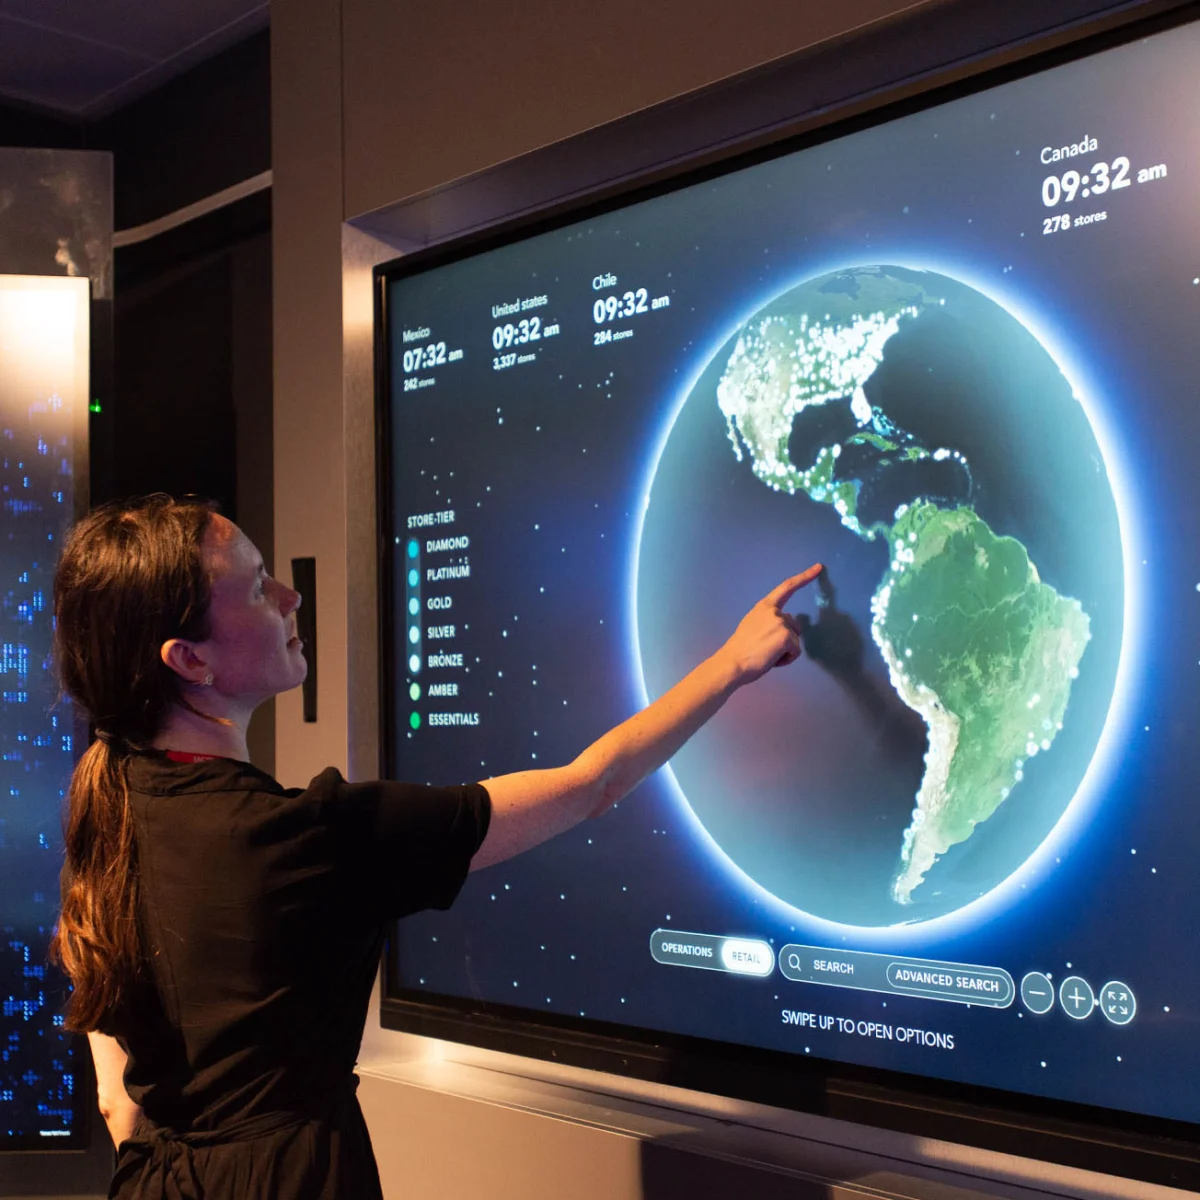
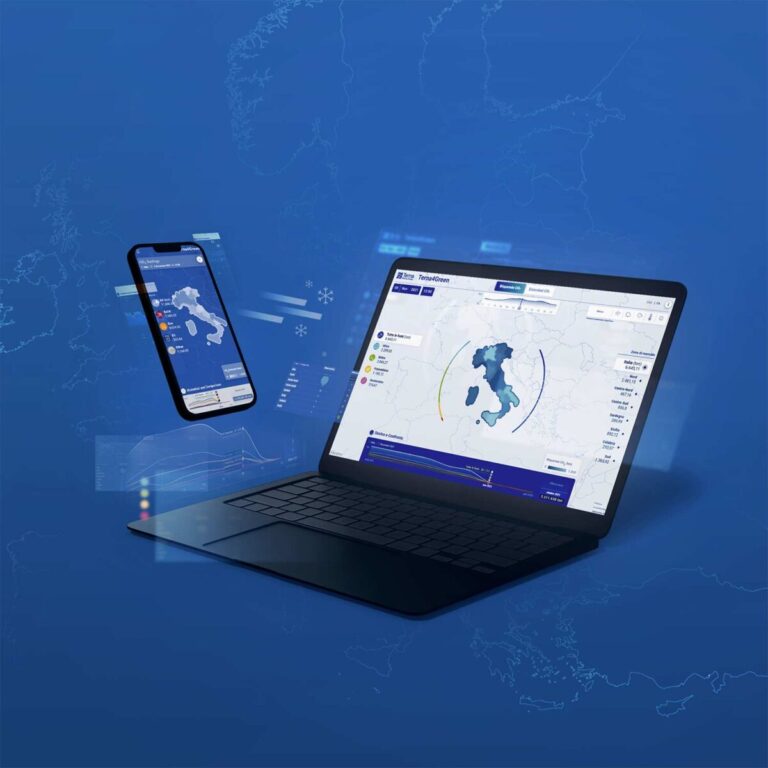
Dynamic elements within the display boost interactivity. At the screen’s summit, crucial information like locations, schedules, and production quantities is seamlessly updated. Set against a backdrop of sky and stars, the map’s continuous movement, mirroring the Earth’s rotation, not only adds a significant decorative element but also captivates the external audience.

Advanced search filter for decision-making

To facilitate decision-making processes and resource coordination, it is possible to carefully examine each location through an advanced search filter. Positioned at the bottom for ease of navigation on the large screen, this filter enables the identification of information organized by continent, country, and city, down to the updated details of individual stores. This thorough analysis not only promotes more efficient management but also reinforces the client’s strategic decisions within the industry.

Our Projects

IMG 1304_cover
TVA Website_D700_COVER 1500 x 1500 px
TER2_TernaCO2_Cover 1500
TER3_COVER 1400
COVER 1500 px
A digital flowchart displays interconnected process steps in Italian, categorized by "Macro fasi," "Fasi," "Sottofasi," and "Attività."

We’d love to hear about your project! Drop us a line