A bespoke atlas of the flora and fauna of The Apennines
Description
Background
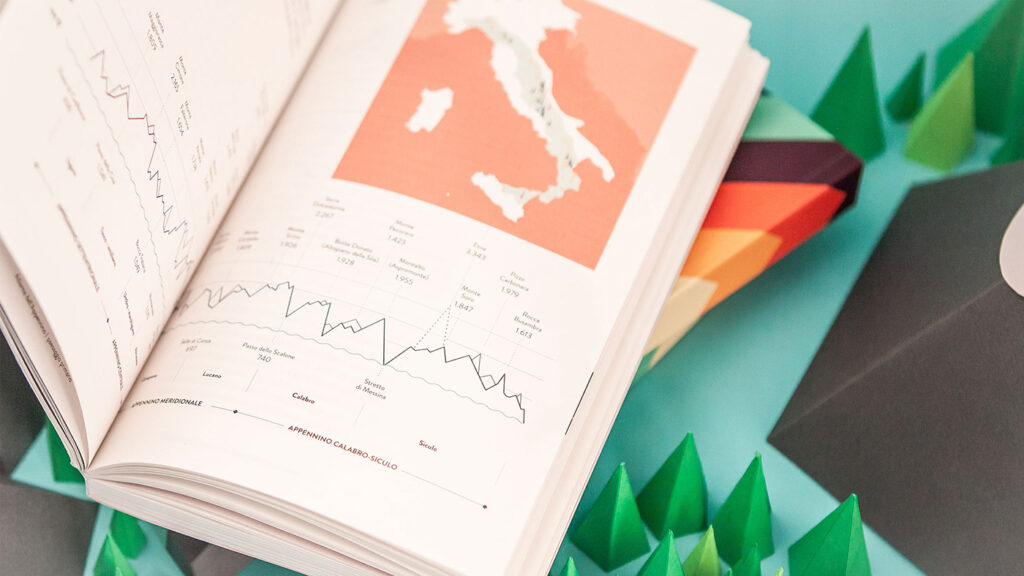
The Apennines Atlas of the Fondazione Symbola is a book that explores the extraordinary environmental and cultural world of the Apennines, a mountain range extending along the length of the Italian peninsula.
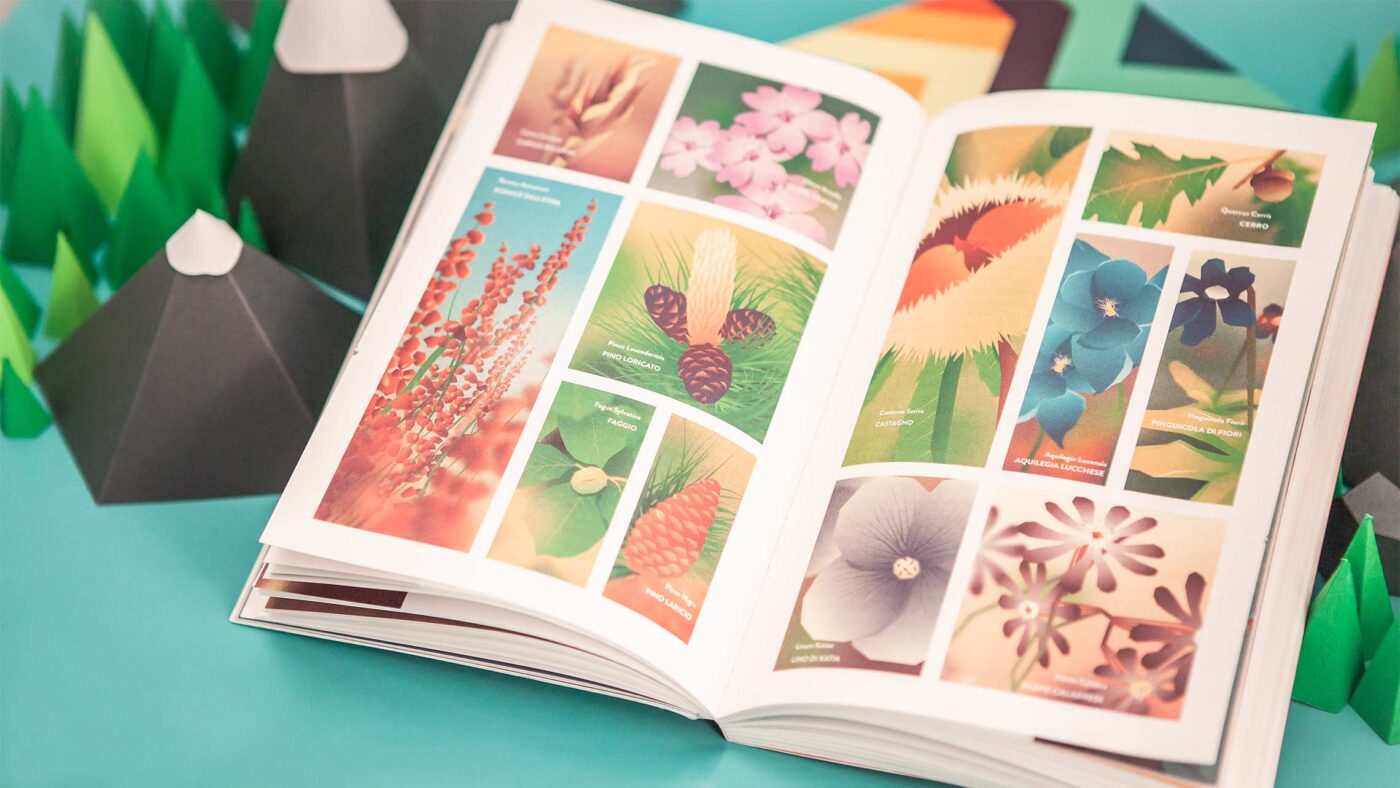
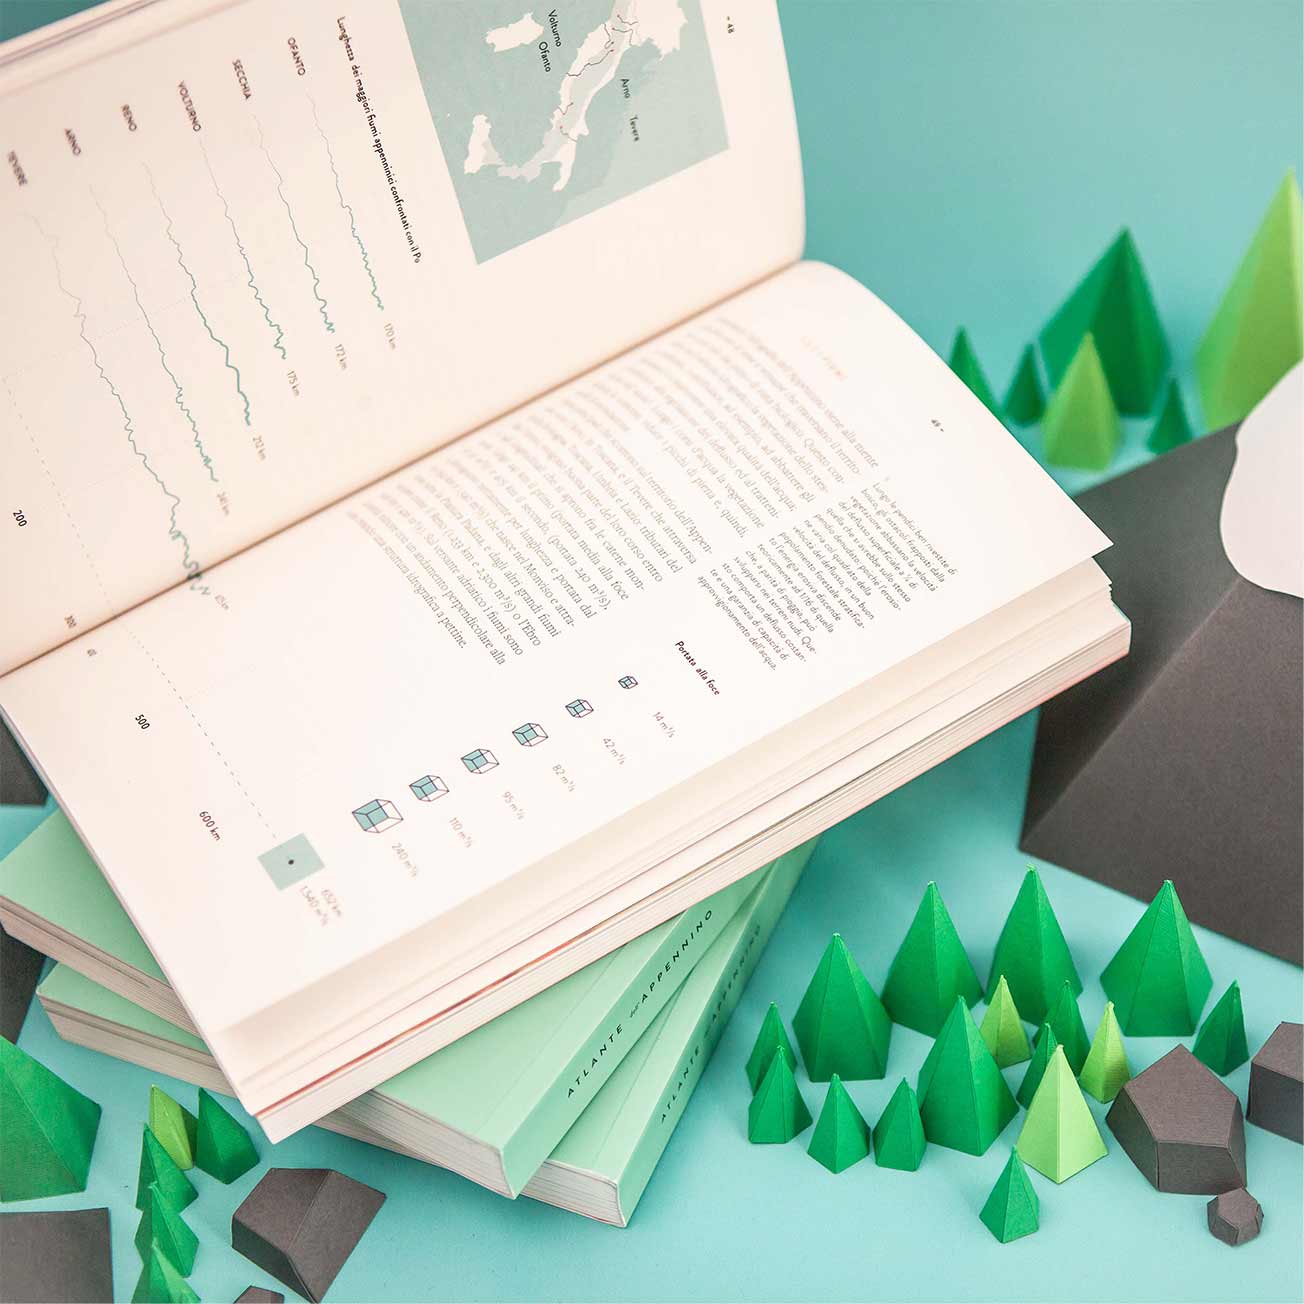
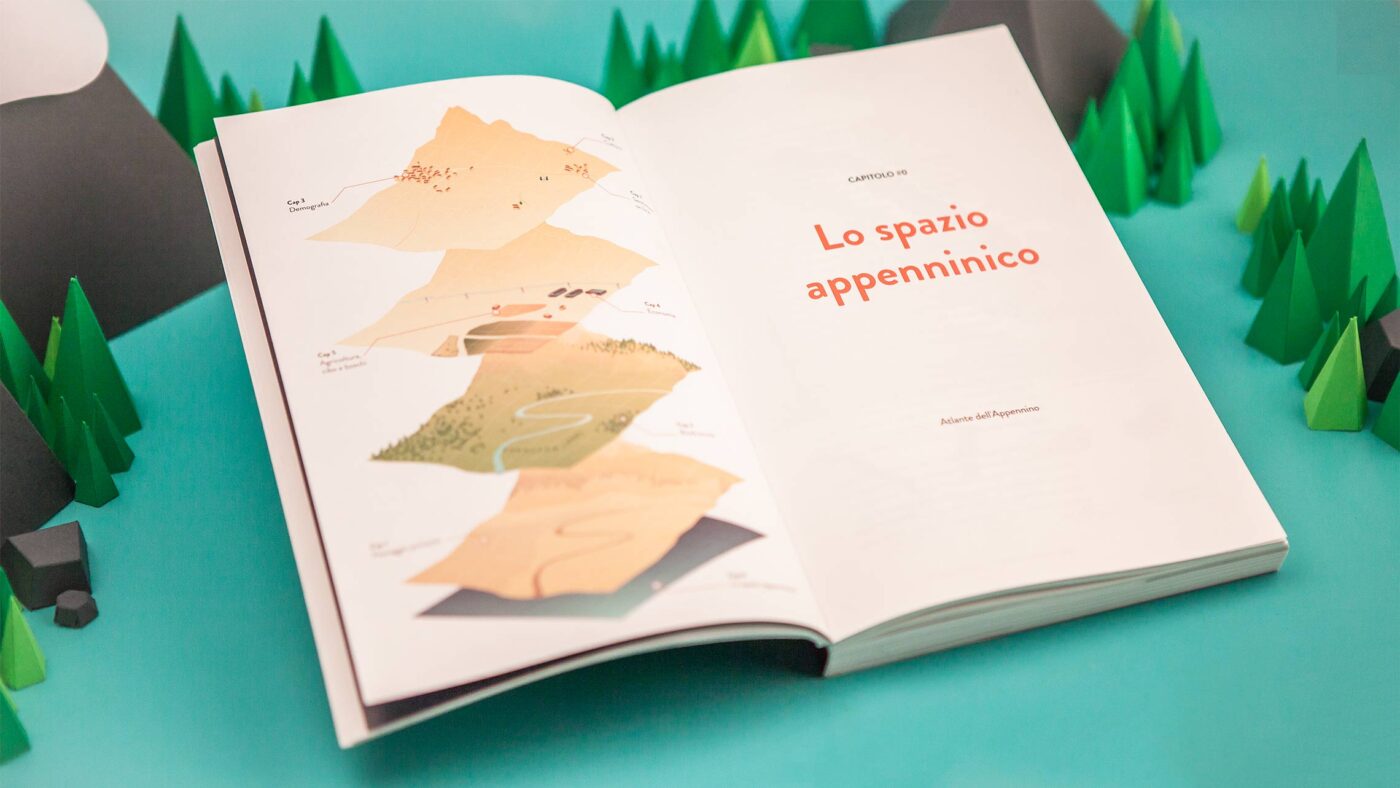
The atlas uses visual designs to explain the geomorphological, hydrographic and climatic characteristics of the landscape, with detailed descriptions of flora and fauna.
It also offers an in-depth insight into the demographic, economic and cultural aspects of the region, together with the digital identity that it has developed on the web. This set of insights matches user data with most frequently searched terms to help understand how people perceive the Apennines.
Objective
Communicate the unique environmental and topographical features of The Apennines mountain range in an educationally stimulating format.
Result
Through the unique design of this atlas, The Apennines is now presented in an engaging and educational way for public audiences and academia.
The Visual Agency designed the Apennines Atlas, which explores the extraordinary environmental and cultural world of The Apennines, a mountain range extending along the length of peninsular Italy.
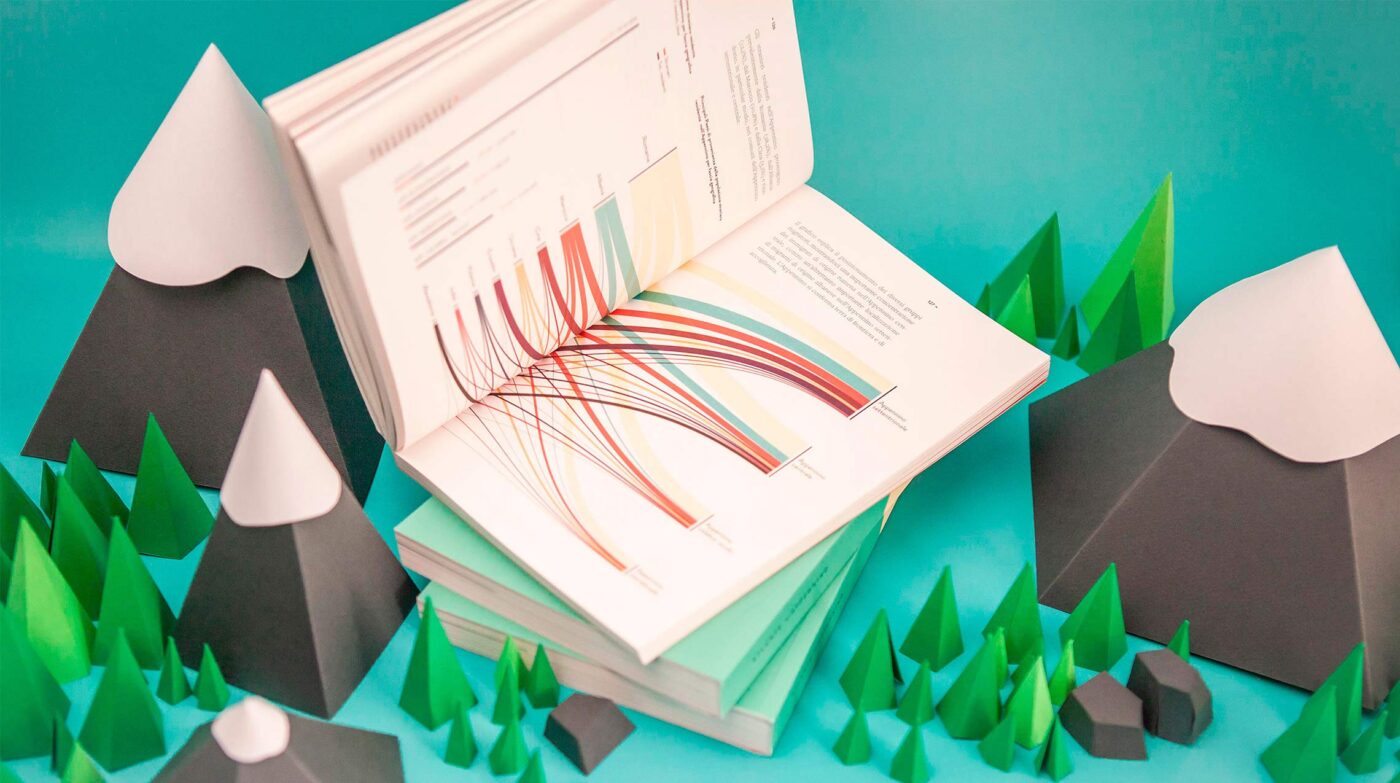
Infographics and maps and illustrations are integrated with the textual narration to highlight interesting information and explore main topics in depth.
Maps & data-visualizations
The Atlas is heavily reliant on visualizations to convey the landscape characteristics: 12 maps display geomorphology and hydrography. 20 illustrations depict the immense animals and plants heritage. 40 infographics deepen numerical-quantitative aspects.
Our Projects
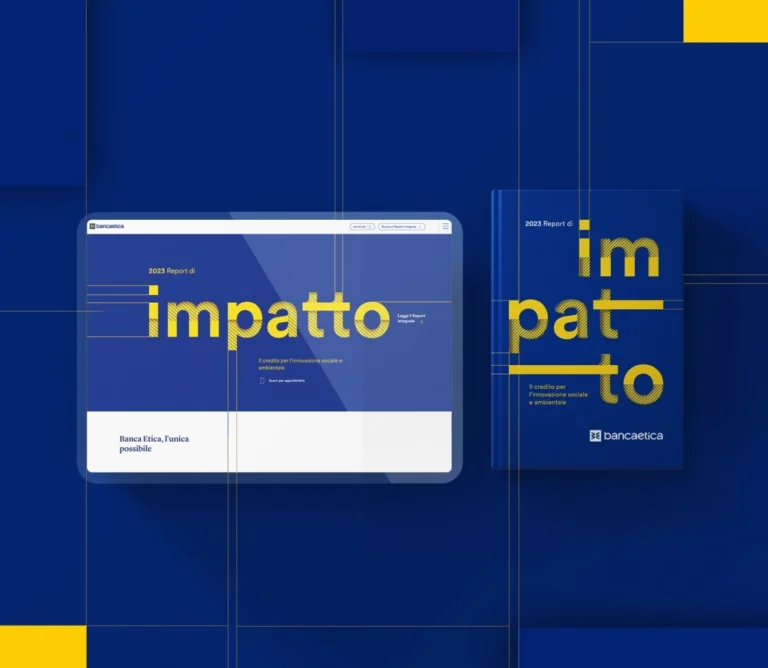
Banca Etica
Sustainability reporting
Banca Etica: B-corp Report of Impact
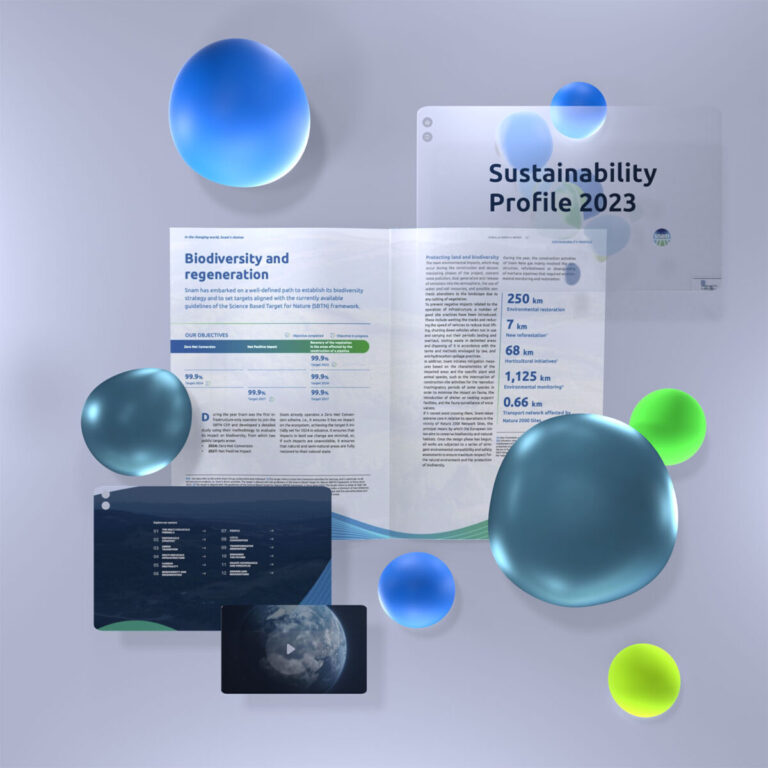
Snam
Sustainability reporting
Communication ecosystem for corporate sustainability
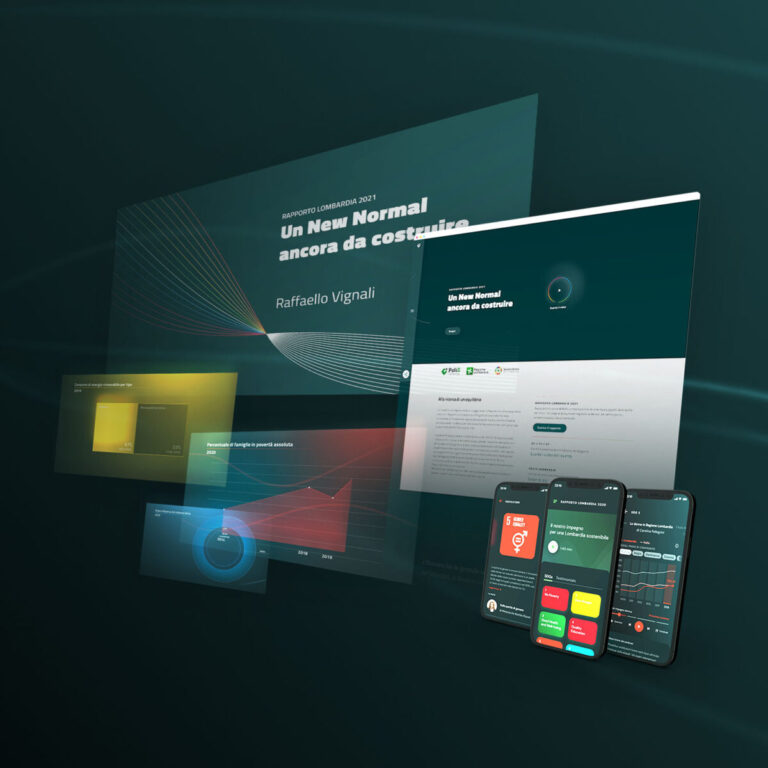
Polis Lombardia
Sustainability reporting
The sustainability report of the future: interactive, multimedia, for everyone
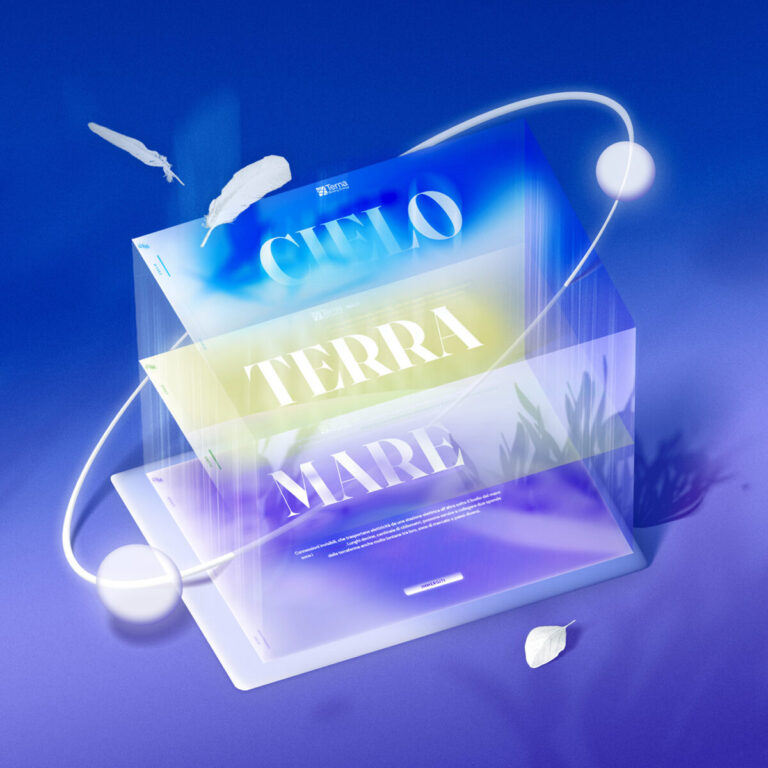
Terna
Dashboards and data visualization, Sustainability reporting
An immersive platform to communicate sustainability
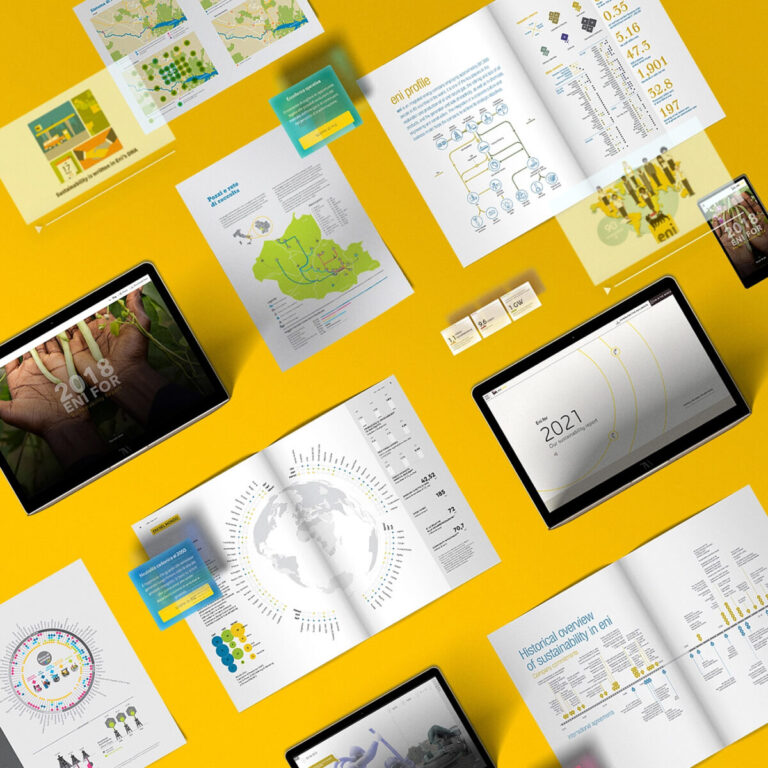
Eni
Sustainability reporting
Eni For: a sustainable story
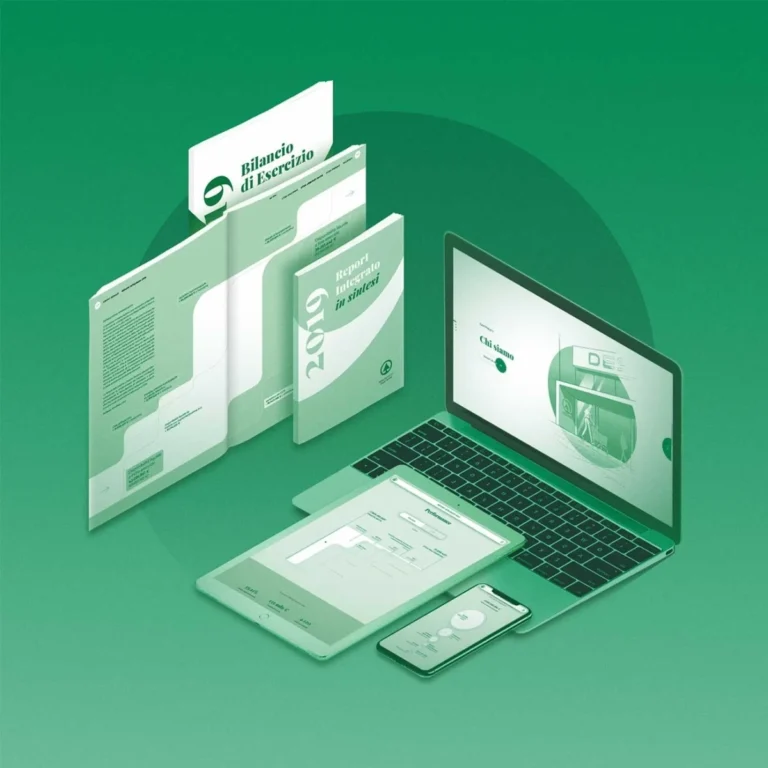
Despar
Sustainability reporting
A new generation of annual reporting
No posts found
We’d love to hear about your project! Drop us a line